Knowledge journal / Edition 2 / 2021
Phosphate concentrations in groundwater under Dutch farms are mostly below target value
Phosphate remains a problem for the quality of surface waters in the Netherlands. However, phosphate concentrations in groundwater receive less attention. For the first time, we investigated long-term trends in phosphate concentrations in the upper groundwater on 165 Dutch farm holdings. Target values for phosphate in groundwater, which are much higher than the quality criteria for surface water, are rarely exceeded.
Phosphorus remains a problem for the quality of surface waters in the Netherlands. Due to policy measures, the annual phosphorus surplus on fertilized agricultural soils in the Netherlands has been decreasing steadily since 1990 down to 5 kg P/ha in recent years (Fraters et al. 2020). Nevertheless, long-term application of repeated fertilization in the past has led to accumulation of phosphate in the soil, and sometimes to saturation. Phosphate on agricultural land can reach surface water mainly through leaching and erosion.
Since 2015 there must be a balance between fertilization and crop removal of phosphorus in the Netherlands. Still, since that year a small increase in the nitrogen and phosphorus soil surplus in the monitored Dutch farms was observed (Fraters et al. 2020).
The historical phosphorus surplus did result in increased phosphate contents in agricultural soils. This might eventually lead to phosphate leaching to groundwater. Phosphate does not leach easily because it can be taken up by the crop and it can bind effectively to soil components. However, there are limits to the capacity of soils to retain phosphate. In almost half of the agricultural land in the Netherlands there were indications in 2014 for a potential risk for phosphate leaching to groundwater (Schoumans and Chardon 2014).
Phosphate quality criteria
The Dutch target value for phosphate in groundwater is 0.4 mg P/liter for sandy areas and 3 mg P/liter for clay and peat areas. The Dutch threshold value for fresh groundwater is 2 mg P/liter for sand areas and is 6,9 mg P/liter for peat and clay areas (https://rvszoeksysteem.rivm.nl/Stoffen). The quality values for peat and clay areas are less strict because these soils produce phosphate upon mineralization of soil. This elevates ‘natural’ phosphate concentrations in groundwater. In the dunes near the sea and in the river clay area the concentrations in groundwater are generally above 3 mg P/liter (van Vliet et al. 2010). In the coastal zone the mineralization of peat layers also leads to high P concentrations in deep groundwater. This groundwater often contains sodium, chloride and other salts of marine origin.
For surface water, the standards are much lower because of the ecological effects of phosphate. The European Water Framework Directive surface water quality criteria of 0.09 or 0.15 mg P/liter, depending on the water type, are commonly exceeded in Dutch surface waters. The average total phosphorus concentration in agriculture specific surface waters was 0.4 mg P/liter in 2020 (Fraters et al. 2020).
Nationwide monitoring program
In the Netherlands we have a national Minerals Policy Monitoring Programme which provides information on the effects of Dutch Minerals policy on agricultural practices and water quality. The RIVM and Wageningen Economic Research cooperate to collect annual information about agricultural practices and water quality on approximately 400 Dutch farms (van Duijnen et al. 2021). For this study, we investigated the trends of phosphate concentrations in the phreatic groundwater on participating farms since 2006. On each farm, the top meter of groundwater was sampled annually from 16 freshly dug boreholes evenly distributed across the farm plots.
The participation of farmers in the monitoring program is voluntary. Each year a number of farmers leave the program and additional farms have to be selected in order to remain a representative nationwide selection of farms. In order to accurately detect trends, we have selected the 165 companies that have been participating continuously since 2006.
Since quite a number of measurements were below the detection limit of 0.013 mg P/liter, we used model calculations to estimate the average phosphate concentration on each farm.
Results
Notably, only five farms (3%) showed a significant increase and no farms showed a significant decrease in phosphate concentration over the years (Fig. 1). Significant means having a p-value with Bonferroni correction of less than 0.05.
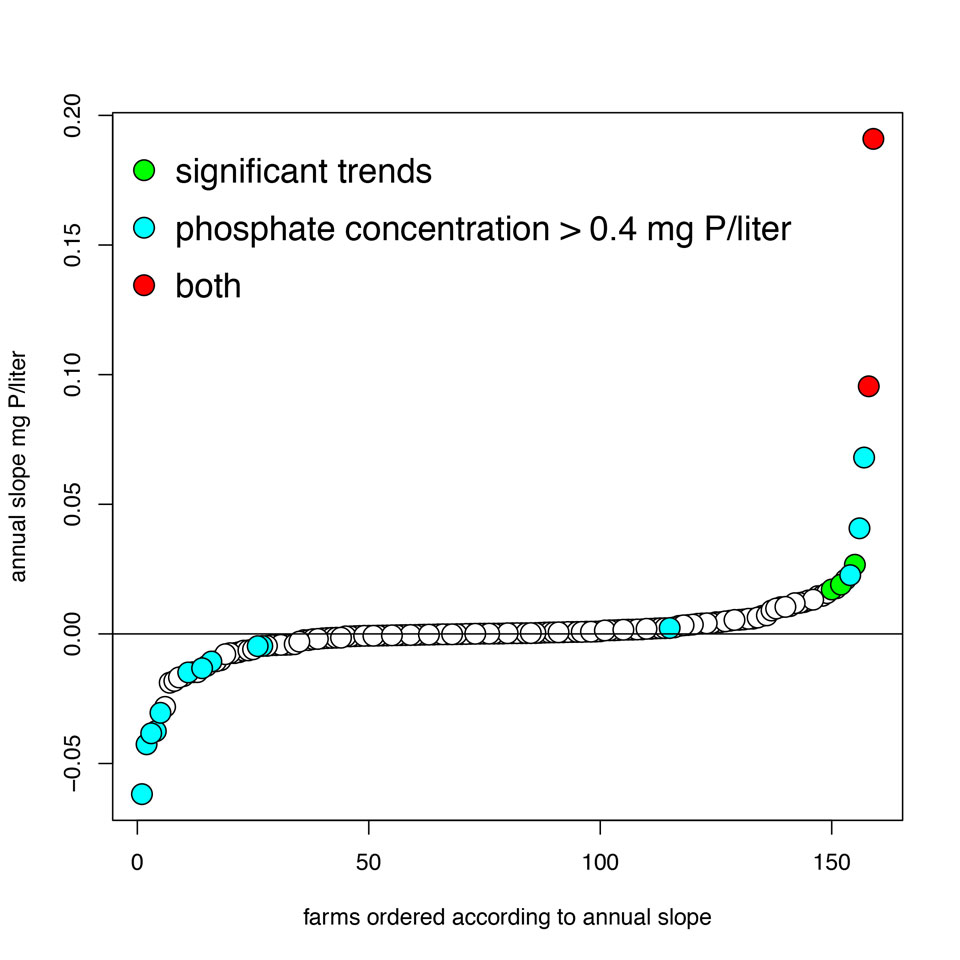 Figure 1. the annual slope of the phosphate concentrations per farm from 2006 till 2020. The 165 farms were ordered according to the annual slope of the phosphate concentration. Most farms are on or close to the horizontal line which indicates there is no slope and therefore no increase or decrease.
Green dots indicate the three farms with a significant increasing trend (P Bonferroni value <0.05) in phosphate concentrations over the years 2006-2020. Blue dots indicate the 14 farms with no significant trend but with phosphate concentrations above 0.4 mg P/liter. The 2 red dots indicate the two farms with both an average phosphate concentration above 0.4 mg P/liter and a significant increasing trend.
Conclusion: 160 farms did not show any significant trend. Only 16 farms (14 blue and 2 red) had a phosphate concentration above 0.4 mg P/liter.
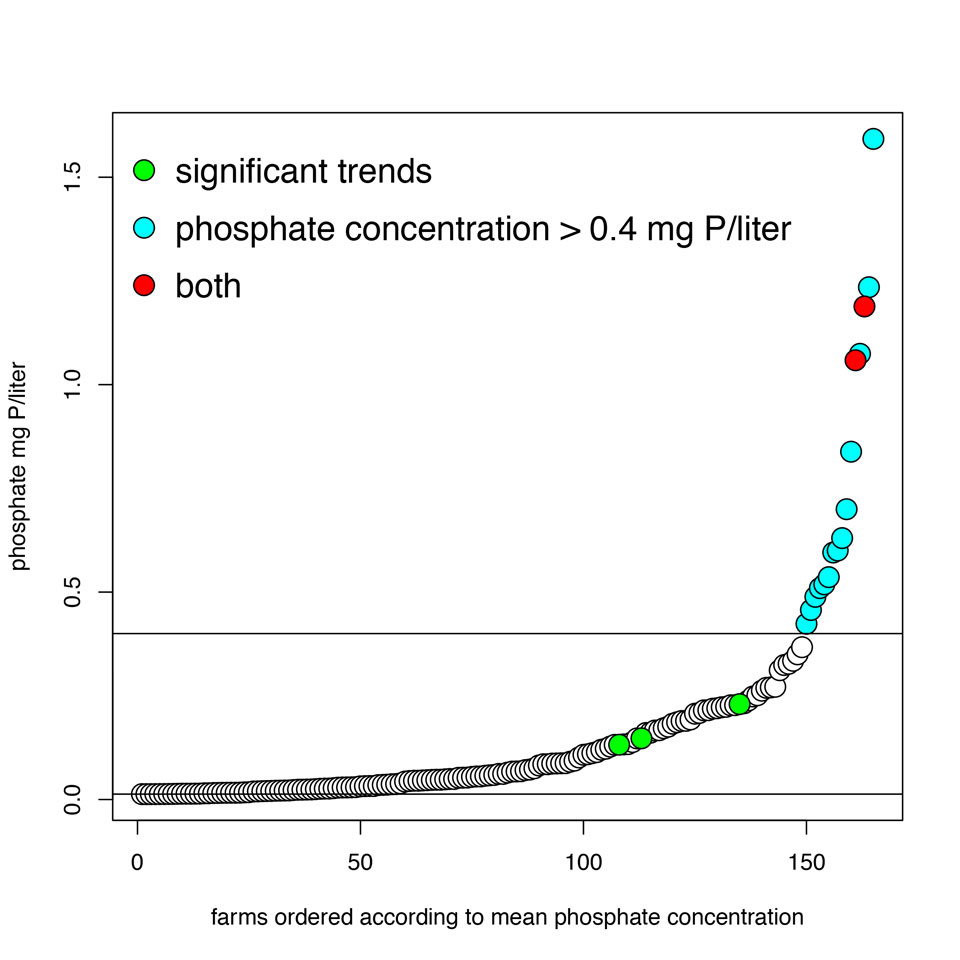 Figure 2. farms ordered with increasing phosphate concentrations from 2006 till 2020. The upper horizontal line indicates the Dutch target value for groundwater in the sand region (0.4 mg P/liter) and the lower one is the detection limit. All farms stay below the Dutch target value of 3 mg P/liter groundwater for clay and peat soils.
In figure 2 the green red and blue dots correspond with figure1. Figure 2 shows that about 90% of the farms have a mean phosphate concentration below 0.4 mg P/liter. Six farms even have a mean phosphate concentration below the detection limit of 0.013 mg P/liter.
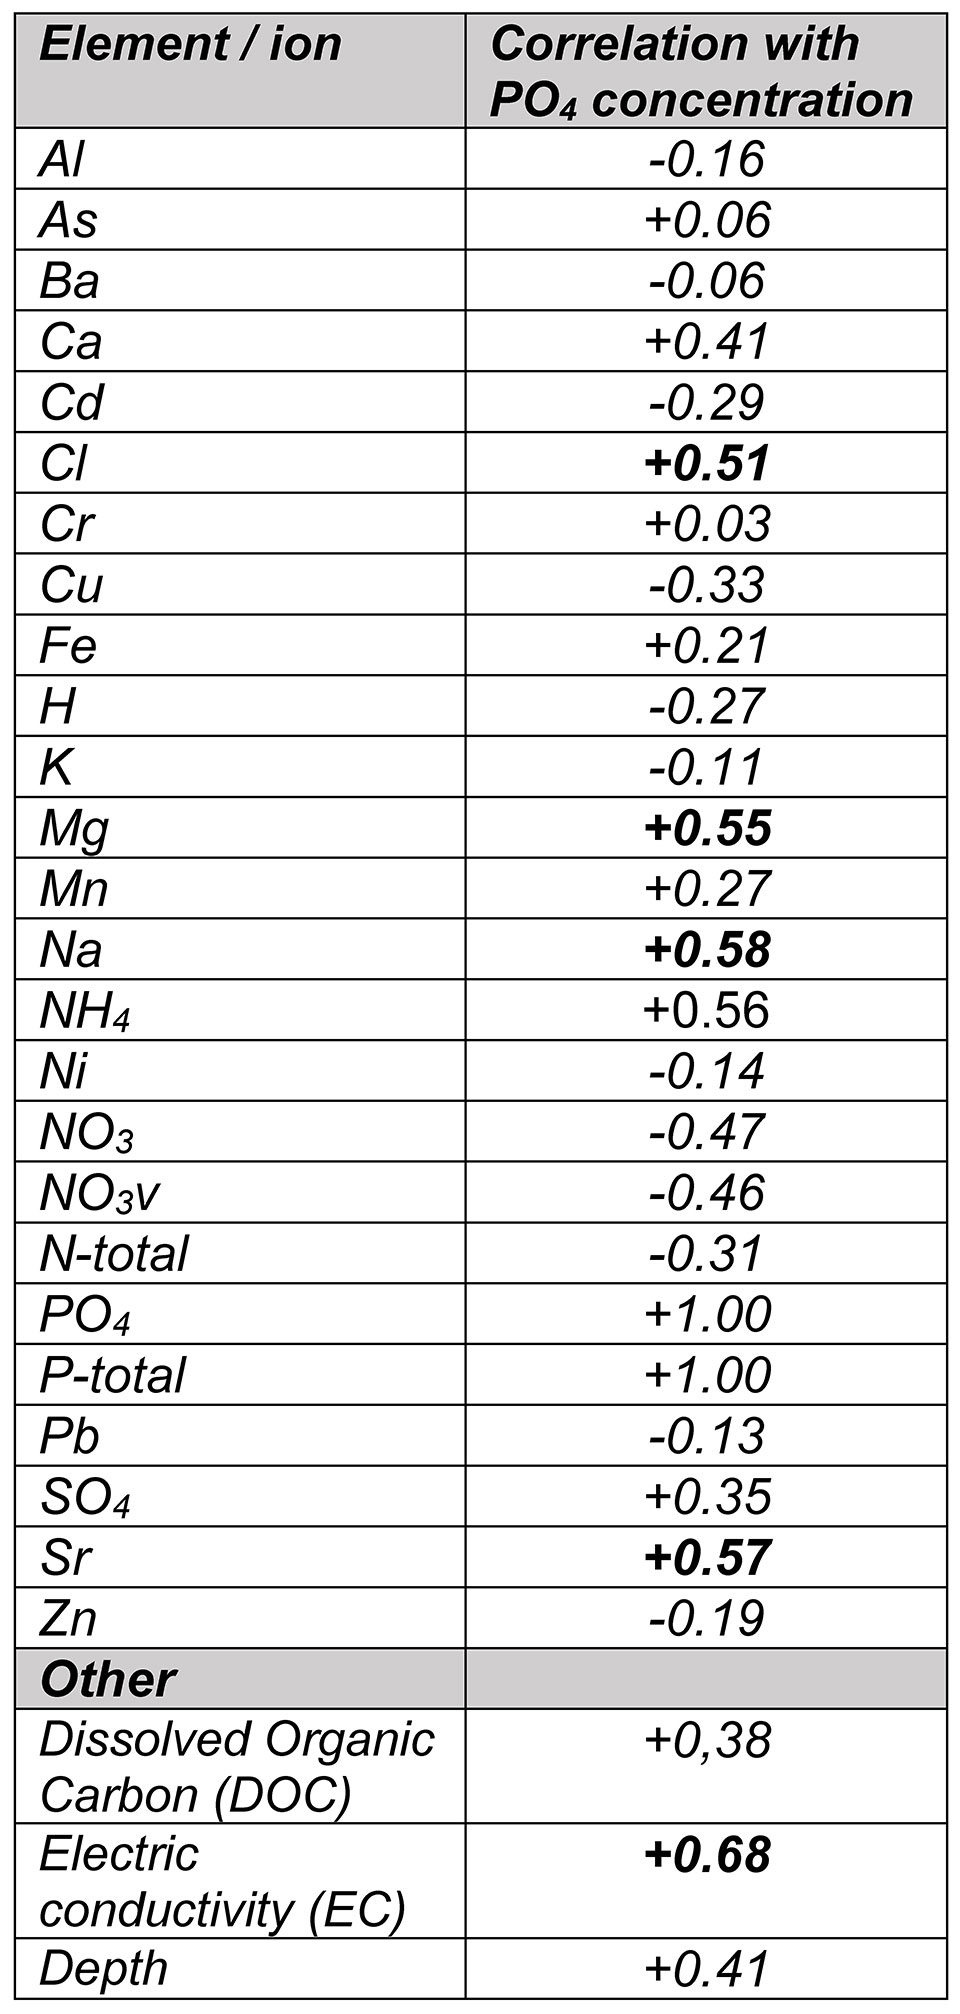 Table 1. The correlation between the mean phosphate concentrations on the farms with a number of other elements/ions.
Table 1 shows that phosphate concentrations correlates with the sea water components chlorine, magnesium, sodium (Na) en strontium and with the electric conductivity EC which is also high in sea water. There is also a positive correlation with ammonium (NH4+), and a negative correlation with nitrate, copper and cadmium. Also, deeper groundwater has higher phosphate concentrations.
Discussion
This study shows that only a very limited percentage of farms had a positive phosphate trend in the upper groundwater. In the Netherlands the deeper groundwater contains elevated levels of seawater components like Cl, Na, Sr, Mg and the electric conductivity. We found a positive correlation between phosphate concentrations and the sea water components. In addition, a positive correlation with ammonium (NH4+) was found which occurs commonly in deeper anaerobic ground water.
Deeper groundwater layers in the peat and clay regions of the Netherlands show elevated phosphate and ammonia concentrations due to the historic mineralization of peat layers (van Vliet et al., 2010). We now also observe on a few farms an increase in phosphate and ammonium concentrations in the upper groundwater. On rare occasions this will be due to phosphate coming from the soil surface but the main cause is probably the upwelling of deeper groundwater.
The phosphate concentrations in the upper groundwater in this study are in correspondence with the phosphate concentrations in the Flemish sandy region (Mabilde, De Neve, and Sleutel 2017). Our data show that even the lowest target value for phosphorus is rarely exceeded in the upper groundwater under Dutch farms. This target value is much higher than the surface water quality criteria from the European Water Framework Directive. Overfertilization with phosphorus still remains a serious problem for terrestrial and aquatic ecosystems but apparently not yet for Dutch groundwater. But as the target values for phosphate in groundwater are much higher than for surface water. it is possible that groundwater discharge through leaching or drainage leads to high phosphate concentrations in surface water.
Patrick van Beelen
(National Institute for Public Health and the Environment (RIVM))
Annemieke van der Wal
(National Institute for Public Health and the Environment (RIVM))
Summary
The Dutch Minerals Policy Monitoring Programme monitors the groundwater quality. The phosphate concentrations in the upper meter of the groundwater were lower than the target value of 0.4 mg P/liter at most of the 165 farms participating since 2006. Only five farms showed a significant increase of the phosphate concentration in groundwater while the other farms did not show any significant trend.
Acknowledgements
The authors thank the LMM monitoring team and TNO for groundwater sampling and analyses. This research was funded by the Ministry of Agriculture, Nature and Food Quality.
References
Fraters, B., A. E. J. Hooijboer, A. Vrijhoef, A. C. C. Plette, N. van Duijnhoven, J. C. Rozemeijer, M. Gosseling, C. H. G. Daatselaar, J. L. Roskam, and H. A. L. Begeman. 2020. 'Landbouwpraktijk en waterkwaliteit in Nederland; toestand (2016-2019) en trend (1992-2019) : De Nitraatrapportage 2020 met de resultaten van de monitoring van de effecten van de EU Nitraatrichtlijn actieprogramma's', RIVM rapport 2020-0121: 232.
Mabilde, L., S. De Neve, and S. Sleutel. 2017. 'Regional analysis of groundwater phosphate concentrations under acidic sandy soils: Edaphic factors and water table strongly mediate the soil P-groundwater P relation', Journal of Environmental Management, 203: 429-38.
Schoumans, O. F., and W. J. Chardon. 2014. 'Phosphate saturation degree and accumulation of phosphate in various soil types in The Netherlands', Geoderma, 237: 325-35.
Van Duijnen, R, PW Blokland, A Vrijhoef, D Fraters, GJ Doornewaard, and CHG Daatselaar. 2021. "Agricultural practices and water quality on farms registered for derogation in 2019." In Landbouwpraktijk en waterkwaliteit op landbouwbedrijven aangemeld voor derogatie in 2019. Rijksinstituut voor Volksgezondheid en Milieu.
Van Vliet, M. E., A. Vrijhoef, L. J. M. Boumans, and E. J. W. Wattel-Koekkoek. 2010. 'De kwaliteit van ondiep en middeldiep grondwater in Nederland [Quality of shallow and medium-deep groundwater in the Netherlands]', RIVM rapport 680721005
Auteurs

Patrick van Beelen
(National Institute for Public Health and the Environment (RIVM))

Annemieke van der Wal
(National Institute for Public Health and the Environment (RIVM))