CONTENTS

Knowledge journal / Edition 1 / 2020

PREFACE

Research with a view to practical application

You have before you the tenth edition of Water Matters, the knowledge magazine of journal H2O. You will find ten articles on a wide range of subjects, written by water professionals based on thorough research.

During the review, the editorial board made a selection that looked at a clear relationship with daily practice in the water sector, the purpose of Water Matters. Research, results and findings must be new and generate articles that provide new knowledge, insights and techniques with a view to practical application.

This edition covers a wide range of topics, including current themes, such as analyses of sewage, saving water and flood management. Furthermore: use of remote sensing in sea and coastal modelling, removal of micropollution out of effluent from individual treatment of wastewater (IBA systems), update of the Watson database, source of contaminants from regional waters, the follow-up to the removal of medicine residues on wastewater treatment plants and 'green' flocculants from wastewater.

Water Matters is, just like H2O, an initiative of the Royal Dutch Water Network (KNW), the independent knowledge network for and by Dutch water professionals. KNW members receive Water Matters twice a year as an appendix to their H2O journal.

The publication of Water Matters is made possible by leading players in the Dutch water sector. These Founding Partners are ARCADIS, Deltares, KWR Watercycle Research Institute, Royal HaskoningDHV and Stichting Toegepast Onderzoek Waterbeheer (STOWA). With the publication of Water Matters, the participating institutions want to make new, applicable water knowledge accessible.

You can also read Water Matters digitally on H2O-online (www.h2owaternetwerk.nl). In addition, this publication is also available as a digital magazine in English via the same website or via www.H2O-watermatters.com.

The English-language articles can be shared from the digital magazine on H2O-online. Articles from previous editions can also be found on the site.

Enjoy reading this edition. Would you like to react? Please let us know via redactie@H2O-media.nl

Monique Bekkenutte Publisher (H2O Foundation)
Huib de Vriend Chairman editorial board of Water Matters

PREFACE

A view to practical application

Knowledge journal / Edition 1 / 2020

Microbial fingerprint for source tracking in surface water management

The quality of Dutch surface water is under pressure, partly due to sewage overflows, and effluent discharges from wastewater treatment plants. These can potentially contain faecal or other harmful micro-organisms. Is DNA fingerprinting suitable for identifying microbial contaminants, and detecting the location of the source?

Because of sewage overflows and discharges of effluent from wastewater treatment plants, surface water managers face changes in the quality of the surface water. From a management perspective, it is important to know precisely where these discharges originate from. Water managers (municipalities and water boards) have the following questions in this respect:

1. Is the impact of sewage overflows on the surface water recognisable and is it traceable to a specific overflow?
2. Is the discharge of effluent from wastewater treatment plants traceable, and if so, up to how far from the source?
3. Is leakage to the groundwater from a wastewater treatment plant’s aeration tank or from the effluent traceable, and up to what distance?
4. Is the origin of surface water that discharges into other surface waters (e.g. polder water in flood storage basins) traceable?

Each type of water (surface water, effluent from wastewater treatment plants, sewage, groundwater) has its own specific microbial composition, or unique microbial ‘fingerprint’. The quality of the effluent from wastewater treatment plants varies over time, however (Emissions Register; 2019), as does the frequency and extent of sewage overflows. This study aims to establish whether the microbial fingerprint can be used to answer the questions above.

Study design and method

To determine a microbial fingerprint, a marker gene in the DNA of all micro-organisms in the water is mapped. This is done using NGS (Next Generation Sequencing, NGS), a technique that is able to decipher the code of very many different DNA molecules simultaneously.

For this study, samples were taken of the influent and effluent from five wastewater treatment plants and of surface water (32 locations). For question 3, samples were also taken from the wastewater treatment plant aeration tank and four groundwater monitoring wells. The samples were taken over the periods of June-November 2017 and March-September 2018. DNA was isolated from the samples to determine the microbial fingerprint. This was done in two stages: specific DNA sequences were determined with NGS, and then with bioinformatics software (Schloss et al., 2009 and Andersen et al., 2018) to establish the associated microbial fingerprint. Finally, the Source Tracker tool (Knights et al., 2011) was used to determine the source type of the microbial fingerprints.

Determining microbial fingerprints

For each location (wastewater treatment plant), an average was taken of the results of the samples analysed. Figure 1 shows the averages for the most common microbes for, respectively, the effluent and the influent (sewage) from the wastewater treatment plant. The effluent has a recognisable profile with characteristic microbial groups such as Saccharimonadales, Neisseriaceae and Fodinicola. The fingerprint of effluent appears to differ for each wastewater treatment plant, more than the profile of sewage.

Wastewater treatment plant influent (sewage) has a very typical microbial community, comprising both faecal micro-organisms (originating from the intestines of humans and animals) and bacteria that mainly grow in the sewage. Characteristically, these include Arcobacter, Acinetobacter, Aeromonas and Trichococcus.

Figure 1: The ‘microbial fingerprints’ of wastewater treatment plant-effluent and influent. The 25 most common microbial genera can be seen in both sample types. The occurrence (abundance) is expressed as an average relative abundance (% read abundance) per sample type (average of the various times samples were taken) at the sample sites 1 to 7.

Were the questions answered?


Question 1: Tracing sewage overflow
Its highly specific profile makes sewage from overflows traceable in the receiving surface water. From the microbial fingerprint, it is thus possible to determine to what extent a body of surface water is impacted by overflows. Furthermore, we not only see the same specific and stable image of sewage in the Netherlands, but also in the united States, Australia, Brazil, China and Spain, for example (McLellan et al., 2019). Wastewater is therefore probably traceable everywhere by means of these indicator bacteria.
The flip side is that wastewater from different locations and different points in time is so similar that it was impossible to determine precisely which overflow the micro-organisms found originated from if several overflows are active in the area. If a sample had been taken at a point very close to an overflow, this could have been possible, and the overflow frequency could possibly have been determined.

Question 2: Tracing of effluent from wastewater treatment plants
To determine the traceability of effluent in surface water, a total of 32 samples were taken at different times of the year from five points in the receiving surface water (Stream 1) and in the water into which Stream 1 discharges (Stream 2). Figure 2 shows the sample points.
The surface water samples from immediately before and after the wastewater treatment plant discharge point were compared with the effluent using the Source Tracker tool. This tool is able to quantify to what extent the microbial population of a given water sample is influenced by that of another. This is also shown in figure 2.
It can be seen that the microbial population of sample site 1 is 41% under the influence of the population from wastewater treatment plant effluent. It was not determined whether this is effluent from the (downstream) nearby wastewater treatment plant, or effluent from other wastewater treatment plants. Sample site 3 (just after the wastewater treatment plant) contains a higher percentage of wastewater treatment plant effluent (70%). Furthermore, at different sampling times, sample site 1 was far more greatly influenced by wastewater treatment plant effluent. The composition of the effluent (sample point 2) also varies over time; the microbial profile of the effluent and the proportion of it in surface water thus varies over the seasons.
Sample site 4 is located in a larger body of receiving surface water (Stream 2), upstream of the point where stream 1 discharges, and there is virtually no influence from the wastewater treatment plant effluent. Downstream, at sample site 5, the effect is clearer; far more limited than at sample site 3, but still perceptible.
It can be concluded that the microbial fingerprint presents opportunities to indicate the influence of wastewater treatment plant effluent on surface water quality, but reducing it to a specific wastewater treatment plant appears more difficult.

Figure 2: Microbial fingerprint of the measurement sites 1 to 5. Situation: wastewater treatment plant (WWTP) discharges effluent into Stream 1, which discharges into Stream 2. The pie charts show the relative proportion in the samples (calculated in %, using Source Tracker) of some characteristic bacterial genera associated with the fingerprint of wastewater treatment plant effluent.

Question 3: Is leakage to groundwater traceable?
A further application of NGS is in determining possible leakage from a wastewater treatment plant into the groundwater. To this end, samples were taken throughout the year from a) the groundwater around a wastewater treatment plant, b) wastewater treatment plant influent, activated sludge from the aeration tank and effluent and c) the receiving surface water.
The microbial profile of influent, effluent and the aeration tank was traceable in the groundwater (monitoring wells). This indicates leakage. It was notable that chemical analyses (NH4 and CZV) carried out earlier showed no traces of leakage. Examination using the microbial fingerprint may therefore be interesting in detecting leakages from the wastewater treatment plant.

Question 4: Are mixed surface waters traceable?
The measurements in the surface water systems examined show that the fingerprint of a water system has specific characteristics; these vary over time, however. To obtain a precise picture of the effect of the outflow of one surface water flow into another water flow, an accurate fingerprint is needed; to do this, it is necessary to takes measurements from both flows over time (over the seasons).

Follow-on research and applications

This study clearly shows that the microbial fingerprint, together with the Source Tracker, can in principle be used to trace the origin and relative influence of water types.
The task now is to determine how this method can be applied in practice to the research and monitoring of (waste) water management. Among other things, our results need to be validated by comparing them with the results from traditional methods of determining water quality, such as E. coli and enterococcal colony counts.
A further interesting aspect for follow-on research is to look at the extent to which quantitative data (the volume of ‘different’ water flowing in) can be derived from qualitative data (the type and relative volume of a given microbial population in a water type). A follow-on phase could then compare flow data and nutrient loads from water system analyses with the results from the microbial fingerprint.
Another question is: how does a population of micro-organisms from wastewater treatment plant effluent develop in the time following discharge into surface water?
The microbial fingerprint could also help to answer the question of what is the optimal microbiological composition of ecologically healthy water, and whether it complies with the European Water Framework Directive.

Peer Timmers
(KWR)
Joost van den Bulk
(Tauw)
Leo Heijnen
(KWR)
Edwin Kardinaal
(KWR; Bureau Waardenburg)
Susan Sollie
(Tauw)
Gertjan Medema
(KWR and TU Delft)

Summary

Wastewater overflows, leakages of wastewater and the discharge of effluent from wastewater treatment plants have a major influence on surface water quality. The task now is therefore to have the capacity to effectively monitor the influence of sewage and wastewater treatment plant effluent on groundwater and surface water. Wastewater and wastewater treatment plant effluent have characteristic microbial fingerprints, which fluctuate little over time compared with surface water and groundwater. This study demonstrates that this fingerprint can be used to effectively trace sewage and wastewater treatment plant effluent in groundwater and -surface water.


Acknowledgements

This study was co-financed with PPS funding from the Ministry of Economic Affairs and Climate Policy grant for Top Consortia for Knowledge and Innovation (TKIs). The results are public. With thanks to all our partners: Wetterskip Fryslân, Vallei & Veluwe Water Authority, Hollands Noorderkwartier Water Board, De Stichtse Rijnlanden Water Board, Hunze en Aa’s Water Authority, Rivierenland Water Authority, Rijnland Water Board, the Municipality of Utrecht and BaseClear B.V.

References

Andersen K., Kirkegaard R.H., Karst S.M., Albertsen M. (2018). Ampvis2: an R package to analyse and visualise 16S rRNA amplicon data. bioRxiv.

Emissions Register (2019). www.Emissieregistratie.nl: annual figures 2017. RIVM, PBL, CBS, RWS-WVL, Wageningen Environmental Research, Deltares, RVO, and TNO.

Knights, D., Kuczynski, J., Charlson, E. et al. Bayesian community-wide culture-independent microbial source tracking. Nat Methods 8, 761–763 (2011). https://doi.org/10.1038/nmeth.1650

McLellan S. L., Roguet A. (2019). The unexpected habitat in sewer pipes for the propagation of microbial communities and their imprint on urban waters. Curr Opin Biotechnol, 57: 34-41.

Schloss, P. D., Westcott, S. L., Ryabin, T., Hall, J. R., Hartmann, M., Hollister, E. B., ... & Sahl, J. W. (2009). Introducing mothur: open-source, platform-independent, community-supported software for describing and comparing microbial communities. Appl Environ Microbiol, 75(23): 7537-7541.

^ Back to start

DNA FINGERPRINT

Identifying microbial contaminants

Knowledge journal / Edition 1 / 2020

Integration of COPERNICUS Satellite and Large Scale Model Data into Localized High Resolution Sea & Coastal Modelling

Local problems such as harmful algal blooms can sometimes occur in many places along the coast. The consequences of industrial activities can also vary greatly from place to place. Governments and other stakeholders can benefit from localized sea and coastal models to help them take the right measures. By using Remote Sensing and smart modelling, development of such models becomes much less time-consuming and costly.

The development of localized models can often be a cumbersome and time-consuming task, particularly when developing the driving conditions for such models and locating sufficient information for calibration and validation procedures. However, Remote Sensing (RS) provides ever increasing coverage and resolution, both spatial and temporal, of key parameter data sets and is an increasingly attractive resource for the calibration, validation, and state-updating of models.
The European Space Agency’s (ESA) COPERNICUS program provides a large array of freely available RS data about the marine environment. These products are already integrated with the Copernicus Marine Environment Monitoring Service (CMEMS), and supply large scale global and regionalized models with data for hindcasting (running models on historic data to provide information on past events) and future projections.
These two sources combined provide the starting material for localized and/or problem specific models. Global and regional outputs are downscaled to rapidly set-up and calibrate localized models.
This approach is particularly beneficial in data poor regions. The large spatial and temporal coverage of the global models and RS products for seas and coasts, for what is traditionally an information sparse system depending on few and far between monitoring stations or infrequent and costly monitoring campaigns, is a boon to the field. The framework used to develop localized models, if automated, could enable municipalities and regional authorities with limited funding to conduct investigative studies on marine and coastal developments, construct localized observatories, as well as monitoring ecological conditions.

Method

In this study, three localized models for European waters were generated based on a combination of global and regional models and RS data; making use of new SENTINEL satellite data sets. Developing the models was done as part of the H2020 ECOPOTENIAL and H2020 ODYSSEA projects.
The localized models are ‘nested models’, i.e. models that operate within the boundary conditions of the underlying large scale models, but function independently. In all three cases below the coastal modelling system is based on the Delft3D modelling suite.
The accuracy of the remote sensing data is limited, but due to the application of error statistics and uncertainty analysis they can still be useful in calibrating and validating local models, especially hydrodynamic and biogeochemical models.

Figure 1: Conceptual Framework of the development of a localized model for the case of the Wadden Sea (ECOPOTENTIAL Project in which CMEMS and SENTINEL data services were used).

Broadly speaking the following three cases followed the framework that was used to set up a model for the Wadden Sea in the ECOPOTENTIAL project. Figure 1 shows that in that case Copernicus data provided additional calibration and validation points to complement existing Dutch monitoring provided by Rijkswaterstaat (RWS; Directorate-General for Public Works and Water Management) monitoring campaigns and stations. Optical satellites provided additional data on biological processes over the entire area which were impossible to obtain through conventional measurements. With the new localized model the primary production from algae within the Wadden Sea can be monitored much better and harmful algal blooms can be better predicted.
In a similar way, data from optical satellites on suspended sediments in the water column can aid in the calibration and validation of localized sediment transport models. This is critical for understanding the impact of sand mining and dredging activities on the local ecology as well as determining the magnitude and extent of impacts of such activities.

Valencia, Spain

In the case application of the Valencia Coast a hydrodynamic model was generated and validated utilizing CMEMS models. Data from the large scale model and Sentinel Satellite images across the sea surface were used for validation. In this case data assimilation is not yet integrated.
This localized model can now produce high resolution data sets which can inform shipping activities and port activities reliant on specific sea conditions and currents. If a jellyfish bloom Is detected somewhere, with a special ‘plug-in’ the model can be utilized to track the spread and impact zones of the jellyfish population. Such information is key for recreation sectors, sea-side communities, and also the fishing and mariculture industries. All these sectors can be negatively impacted by the effects of jellyfish blooms. The warning time that the localized model can provide, allows for actions to be taken in order to mitigate the negative impacts.

Aegean Sea

Another example is the Thracian Sea/North Aegean Observatory, which is located at the northern-most part of the Aegean Sea. Currently this observatory works with a localized model of sea currents and waves; integration of water quality is in progress. Every day the system retrieves CMEMS data of the past day for a 2 days forecast run. The localized model offers high resolution short-term forecasting of the regions’ water levels, currents, and wave heights. This coastal prediction system is run daily, so that timely prediction information is available for the end-users.
Results are validated against the new in-situ instruments deployed within the project, including unmanned gliders and sensor-equipped buoys on site. Early validation of the model with these instruments in 2019 and 2020 showed a first and promising confirmation of the accuracy and reliability of the predictions.
With this localized model an important source of information has become available for maritime activities in the region, such as shipping, off shore energy platforms and fishing, at a high spatial resolution. Validation of the water quality forecasting component will be done by mid-2020. A separate forecast map for water quality, disseminated through social media, is already used by local fishermen.

Figure 2: In the case of the localized Thracian Sea Model, downscaled and adapted CMEMS data are utilized to predict short term flow patterns with high resolution. This information is relevant for maritime activities in the region.

Gulf of Gokova

The third example is the Gulf of Gokova in Turkey, which covers a 100-km long and narrow Aegean Sea gulf, and where a Special Environmental Protection Area (SEPA) has been declared since 1988. Human activities in and around the gulf include agriculture, tourism, fisheries, and maritime activities. The main threats in this area are illegal fishing, tourism, pollution, coastal development and habitat destruction, organic and inorganic waste and invasive species due to climate change and the Suez Canal opening, which allows non-native species to migrate from the Red Sea and Indian Ocean.
In order to perform ecosystem impact assessment and support operation of the above-mentioned sectors, operational forecasts are needed at a better resolution than CMEMS products. Consequently, a high-resolution coastal modelling system was set up to provide operational information on currents, waves and biogeochemistry to the main end-users: cruise companies, ferries to Greece, fishing and sponge diving, recreational fishing, and tourism (hotels, yachts). Assimilation of CMEMS data products is automated to operationally provide temperature, salinity, water level, and current boundaries to this nested model. Copernicus products were complemented with NOAA-GFS meteorological information. Currently operational forecasts are published on social media daily, with more than 100 end-users regularly following the updates. By the end of 2020 dissemination will be done through the ODYSSEA platform for localized observatories along the Mediterranean coast.

Figure 3: Depth pattern for the Gokova Gulf based on Remote Sensing data (in meters).

Towards better and more cost efficient localized models

Continued work is being undertaken to automate the calibration process and to include state-updating of the model. Figure 1 depicts the envisioned final processing chain, which is sought to be achieved through this continued work. To this point, successful integration of Remote Sensing has been achieved in the calibration process. The application of data assimilation strategies is an on-going effort, in order to further refine the models and thus improve predictions. Once the chain has been automated, the cost of effort and time in developing localized models based on these COPERNICUS services will be greatly reduced. This removes the current barriers to the use of these services. Model performance can be further improved through the use of multiple COPERNICUS based and locally available data sets.

Alexander Ziemba
(Deltares, Delft University of Technology)
Lorinc Meszaros
(Deltares, Delft University of Technology)
Ghada El Serafy
(Deltares, Delft University of Technology)
Joe El Rahi
(Ghent University)

Summary

Everywhere along coasts harmful algae blooms, jellyfish blooms or pollution can occur. Locally applicable high-resolution models can predict the spread of such phenomena and help governments and other stakeholders to take action. Developing localized models, normally labour-intensive and costly, has recently become much more feasible. Within the COPERNICUS programme, a framework has been developed to set up localized models as 'nested models' within larger scale models. Important in this respect is the use of Remote Sensing data for validation and calibration, in addition to locally obtained data.


References


https://www.ecopotential-project.eu/

http://odysseaplatform.eu/

https://earth.esa.int/web/sentinel/missions/sentinel-1/news/-/article/copernicus-sentinel-1-supports-detection-of-shoreline-positions

https://sentinel.esa.int/web/sentinel/home/-/journal_content/56/247904/3869448

https://www.copernicus.eu/sites/default/files/2018-10/copernicus4regions.pdf

^ Back to start

COASTAL MODELLING

Benefit of remote sensing

Knowledge journal / Edition 1 / 2020

Practical test to remove micropollutants from OWTS effluent

In outlying areas, on-site wastewater treatment systems (OWTS) are used to treat domestic wastewater. The effluent is generally discharged into small ditches and waterways, the capillaries of the water system. OWTS, including constructed wetlands, are not designed to remove micropollutants such as pharmaceutical residues. The micropollutants discharged can have a negative impact locally on the water quality of these small water systems. Additional treatment technologies can reduce micropollutant emissions.

Discharges today

In 2016, Water Authority Zuiderzeeland conducted research into the discharge of micropollutants from OWTS systems. Most of the micropollutants investigated were found in OWTS effluent, and in higher concentrations than in effluent from wastewater treatment plants. Within the management area of Zuiderzeeland Water Authority, OWTS systems discharge to waterways situated in vulnerable areas with particular ecological potential. For some micropollutants, ecotoxicological effects cannot be ruled out at the concentrations measured in the OWTS effluent. The actual occurrence of effects depends largely on local circumstances and seasonal variations, such as through-flow and drought. Further away from the discharge points, the potential risks decline sharply due to dilution in the water system. Diffusely dispersed OWTS discharges have virtually no effect on water quality across the total water system, but the picture locally can be quite different.

Selection of technologies

There are currently no commercially available technologies specifically for the removal of micropollutants from OWTS systems. Such technologies can be found in other sectors, however. We selected three of them for this study: activated carbon filtration, ozonisation and adsorption with electrochemical oxidation.
The aquariums and ponds industry uses various technologies to remove toxic substances from water on a scale comparable with OWTS systems. Of these small-scale systems, activated carbon filtration and ozonisation (treatment with ozone) were selected because these have already proven effective in removing micropollutants at wastewater treatment plants. The third technology, adsorption with electrochemical oxidation (Ad-EChOx), is used in industrial wastewater purification to remove residual COD (chemical oxygen demand, a common measure for the amount of organic matter in water) and colour, and can also remove micropollutants.
All three technologies were studied as a downstream purification step for OWTS effluent.

Practical test

The practical tests were carried out between November 2018 and February 2019, with a constructed wetland (a reed bed with layers of sand and gravel in which biological and physical processes purify the water) at the research facility of Wageningen University’s Department of Environmental Technology. The constructed wetland (12 m2) has been in use for several years, and is fed with raw influent from Bennekom wastewater treatment plant, primarily of domestic origin. Each day, we pumped 360 litres of influent into the constructed wetland, in four batches. This meant that the COD (chemical oxygen demand, a common measure for the amount of organic matter in water) and the hydraulic loadings were comparable with the OWTS systems in practice (approx. 20 mg COD/m2/d and approx. 30 l/m2/d). Samples were taken of the influent and effluent from the constructed wetland to analyse for micropollutants. The effluent was collected in a buffer tank from where the adjacent downstream technologies (in the garden shed, see photo) were fed.
For the activated carbon filtration, a seven litre Aquaforest AF150 filtration reactor was used, filled with Norit ROW 0.8 SUPRA activated carbon (Cabot Norit Activated Carbon) and operated with a hydraulic contact time of 70 minutes.
The activated carbon filter was operated for 48 days (1,000 bed volumes) in continuous mode with no backwash.
Ozonisation was carried out with a UV ozone reactor (Redox UVC low-pressure, AquaForte). This reactor produces ozone by means of UV radiation; ozonisaton and UV treatment thus take place simultaneously. The ozonisation tests were conducted in batch mode. Per batch, 500 litres of OWTS effluent were circulated over the UV ozone reactor for a period of 5 6 hours. According to the specifications, the reactor produces 0.6 g O3/hour; this was not checked. The concentration of dissolved organic carbon (DOC) in the OWTS effluent was between 9 and 13 mg/l. The calculated ozone dose was thus 0.45 0.75 mg O3/mg DOC.
For the Ad-EchOx tests, a NyexTM demo unit (Arvia) was used, filled with a granular adsorbent with an electrical current. This unit was used to carry out short Ad-EChOx continuous tests of 3 4 hours in the lab from a buffer tank with OWTS effluent, with currents of 1.5 to 2.5 mA/cm2 and flows of 8 and 12 l/hour.

Samples from before and after treatment with the three technologies were analysed for 37 micropollutants (pharmaceuticals). Of these 37 substances, 18 21 were found in the various samples; the removal efficiency of the technologies was calculated for the substances found.

Results - constructed wetland

Two samples were taken of the influent from the constructed wetland to analyse for micropollutants. During the test period, samples were taken from the effluent 11 times, and 25 of the 37 micropollutants analysed were found (figure 1). The removal efficiency of the constructed wetland was calculated for 20 micropollutants. The average removal efficiency was 47%. This is in line with the removal efficiency in a wastewater treatment plant.

Figure 1: Concentrations of micropollutants in the effluent from the constructed wetland (n=11)

Results - activated carbon filtration

The activated carbon filter was considered best at removing micropollutants. On measurement days 21, 33 and 42, the average removal efficiency was more than 90% (see figure 2). On these measurement days, all individual micropollutants were effectively removed; even for the most difficult to remove micropollutants, efficiency was above 80%. Between measurement days 42 and 48, the removal efficiency decreased. The same pattern was observed with DOC removal. This could have been caused by saturation of the filter bed, although this would have been sooner (after just 1,000 bed volumes) than might theoretically have been expected. It is possible that there were preferential flows, as a result of which the entire filter bed was not used optimally. The filter did not become blocked during the test period. A brown deposit was detected on the bottom of the filter, however. The same brown deposit was also detected in the buffer tank in which the constructed wetland effluent was captured. These were presumably undissolved constituents washed out from the constructed wetland. Unlike the activated carbon filters which are used on a larger scale, the activated carbon filter tested has no backwash function. The hypothesis is that the service life of the activated carbon filter increases considerably with a backwash function.

Figure 2: Average removal of 21 micropollutants measured using activated carbon filtration; the error bars indicate the highest and lowest observed removal efficiency.

Results - UV ozone

An average of 33 44% of micropollutants were removed using the UV ozone technology. As expected, the average removal increased with a higher UV ozone dose. Removal efficiencies vary strongly for the individual micropollutants. Over 95% of diclofenac was removed, while maximum 14% of metformin was removed. These differences are directly related to the ozone reaction rate constant, which is high for diclofenac (106 M-1 s-1) and low for metformin (10 M-1 s-1). A better removal efficiency is possible by extending the response time to more than six hours, which increases the ozone dose. The experience with ozone technology at wastewater treatment plants shows that the removal efficiency increases considerably with a higher ozone dose (STOWA 2018-46). However, a higher ozone dose requires higher energy consumption almost in the same proportion. The total energy consumption for the six-hour UV ozone tests was 1.3 kWh/m3. During the tests, ozone concentrations above the maximum accepted concentration (MAC value) for eight-hour exposure were measured in the exhaust air of the UV ozone plant. For safety, this raises the question whether this is desirable when applying the technology. Technically, residual ozone can be captured and/or a more robust installation can be installed. However, this entails additional costs, requires extra space, and does not eliminate the risks of faulty connections or poor maintenance.

Results - Ad-EChOx

The average removal efficiency for micropollutants with the Ad-EChOx was between 7 and 43%. The lowest efficiency was obtained at the shortest retention time and lowest current. Removal efficiency increased to 43% when the retention time was extended and the current increased. Removal efficiencies vary strongly for the individual micropollutants; more than 95% of furosemide was removed, but no iopromide at all. Energy consumption of the NyexTM demo-unit (increasing with a higher current and longer retention time) was between 0.2 and 0.8 kWh/m3. Because the test comprised short batch tests, no conclusions can be drawn regarding robustness. As with activated carbon filtration, the filter bed can become blocked, and regular backwash may be needed for prolonged use. There appears to be plenty of scope for optimisation (retention time and current) of the Ad-EChOx technology. Based on the results of pilot tests with wastewater treatment plant effluent, a higher removal efficiency can be expected with energy consumption of 1.3 kWh/m3.

Synthesis

The results of the practical tests show that all the technologies tested are capable of removing micropollutants present in the effluent from the constructed wetland. The degree of removal for each technology depends on the process conditions set. The highest average removal efficiency is obtained with activated carbon filtration. Taking into account as well an initial cost analysis, this is the most cost-effective and robust technique. Furthermore, activated carbon filtration has the lowest CO2 footprint at 0.26 kg CO2/m3, with UV ozone and Ad-EChOx at 0.69 and 0.70 kg CO2/m3 virtually on a par. Thanks to the relative simplicity of the technology, activated carbon filtration can be implemented in the short term. To precisely determine the cost-effectiveness and robustness, the service life of the activated carbon filter needs to be established in practice. This can possibly be extended by using a backwash function.
The cost-effectiveness of all three technologies is influenced by the concentration of DOC and undissolved constituents in the constructed wetland effluent, and the fluctuation in effluent flow. Further development of OWTS systems to remove more DOC and undissolved substances will help to make the removal of micropollutants more effective. Consideration could be given to a new OWTS class 4 with defined performance requirements for the removal of micropollutants.

Arnoud de Wilt
(Royal HaskoningDHV)
Els Schuman
(LeAF)
Tiemen Nanninga
(LeAF)
Bernadette Lohmann
(Zuiderzeeland Water Authority)
Rien de Ridder
(Zuiderzeeland Water Authority)

Background picture:
Test setup: the helophyte filterconstructed wetland and the garden shed with adjacent downstream technologies


Summary

Discharges from OWTS systems account for only a small part of the total emissions of micropollutants to the aquatic environment. Locally, however, these emissions may have a large impact on the water system. The practical tests described demonstrate that there are technologies almost ready to bring to the market (activated carbon filtration, ozonisation and adsorption with electrochemical oxidation) which can greatly reduce these emissions, and thus improve the quality of the local water system. This is in line with the aim of the national 'Chain Approach to Pharmaceutical Residues from Water' to reduce the volume of pharmaceutical residues in water.

^ Back to start
OWTS EFFLUENT

Remove micropollutants

Knowledge journal / Edition 1 / 2020

The Watson database provides a better picture of the emission routes of micropollutants in water

Water managers are tasked with ensuring good water quality in their management area. Insight into the origin of pollutants – and thus into how emissions can be limited – is a key part of this. The Netherlands Pollutant Release and Transfer Register (Emissions Register) and the accompanying Watson database are important tools in this. Deltares and AD eco advies have updated the Watson database. This article highlights the key results from the analysis of new data, and some of the resulting exciting applications.

The Watson database is often used to estimate emissions from the wastewater chain to surface water. The database contains monitoring data for micropollutants in the influent and effluent of Dutch wastewater treatment plants (WWTP), and is freely accessible to anyone (website: Nederlandse EmissieRegistratie). Emission Factors (EF) and Purification Efficiencies (PE) for substances from wastewater treatment plants are derived from the data (see box) as recorded in the Netherlands Pollutant Release and Transfer Register (Emissions Register). The EF is the emission of a substance (the occurrence in the wastewater treatment plant influent) in grams per inhabitant; the PE is the percentage of this that is removed by a wastewater treatment plant. These parameters can be used to determine emissions from the wastewater chain to the surface water.

Deltares and AD eco advies have completed an update of the Watson database, compiling data for the period from 2014 to 2018. These data were further analysed, and yielded a wealth of interesting data that can be used for all sorts of applications. Thanks to the update, the database now includes data about 1,310 substances, of which 112 have been included in the Emissions Register following further analysis. This article highlights the most interesting results of the analysis and a number of applications.


Determining emission factors and purification efficiencies

The monitoring data in the Watson database of the Netherlands Pollutant Release and Transfer Register (Emissions Register) are obtained from regional water managers. If they are to be usable in terms of extrapolating reliable emission factors and purification efficiencies, these data must meet a number of conditions. For example, to determine the emission factor, at least seven measurements must be available, taken within one year and from a minimum of three different wastewater treatment plants. To determine the purification efficiency, the above data must furthermore be available for three different years. If there are sufficient measurements above the reporting limit (RL), calculation of the emission factor is based on the median value (>50% RL) in the effluent or the influent. Is there is insufficient information available, the average is taken (>25% RL). Values


Pharmaceutical residues

The Watson database already held data on a number of pharmaceutical residues. The recent update has increased the volume of data, and so for a number of a substances, a new or improved emission factor or purification efficiency value has been derived. For example, the key figures for 20 pharmaceutical residues were improved, and 12 substances were added to the Emissions Register. By way of validation, we compared our results with emissions estimates based on sales figures combined with excretion factors. The comparison shows that the results from the two methodologies are generally in line with one another, see figure 1. There are complementary results for a number of pharmaceuticals. These are pharmaceuticals whose sales and/or usage are not well documented, such as over the counter pharmaceuticals (medicines that can be sold freely, for example paracetamol, ibuprofen and diclofenac). The measurements provide a better picture of these. For substances that are broken down quickly, or for which there is no effective analysis method available, emission estimates based on sales figures provide a better overview. Examples of this latter category are cytostatics and metformin.

Figure 1. Concentrations of pharmaceutical residues in wastewater treatment plant influent, measured (x-axis) and estimated on the basis of use (y-axis)

PFAS

Perfluoroalkyl and polyfluoroalkyl substances (PFAS) have recently attracted a lot of attention because of the ubiquitous nature of these toxic substances in soils, surface water and sediments, and the associated risks. Much remains unknown about the sources (type, location, size) from which PFAS reach the environment. The contribution of wastewater treatment plant effluents to the levels in surface water was determined based on the available calculations through to 2018. For a number of compounds in the PFAS group, there are sufficient data to derive both a purification efficiency and an emission factor.
Because the production, along with a large number of applications, of PFOS have been prohibited since 2010, the study looked at whether the concentration of PFOS in effluent has also decreased since then. The available measurements show that this is indeed the case; since 2010, the average concentration in effluents has decreased by 75% (figure 2). This is in line with the patterns of concentrations in surface water over the past ten years. These results suggest that emissions from wastewater treatment plants and flows from abroad together substantially determine the concentrations in surface water (and ultimately in water beds). Further study will be needed to confirm this.
It is notable that some wastewater treatment plants in South Holland have an increased concentration of PFOA compared with the rest of the Netherlands. This is probably the result of atmospheric deposition in the past, caused by the former PFOA production site in Dordrecht, which still causes increased concentrations in the wastewater chain through runoff and leaching from urban run-off and from wastewater.

Figure 2: Progression over time of PFOS concentrations in wastewater treatment plant effluent, based on available measurements. The wastewater treatment plants samples are taken from may vary each year. The boxplots indicate the median (horizontal line), the 25 and 75 percentile (the blue box), and the range (black ‘whiskers’) in concentrations.

Biocides and crop protection agents

A group of substances also found regularly in both influents and effluents are pesticides for domestic applications. These include insecticides (such as fipronil and imidacloprid) and herbicides (for weed control on paved surfaces, such as glyphosate). The emissions from a number of these agents has already been estimated in the Emissions Register, but via different methods and routes. Since these emission estimates are quite rough, the study looked if the data from the Watson database could improve these emission estimates.

Imidacloprid


Limited use of imidacloprid is still permitted in greenhouse horticulture, and is also found in pet medical treatments (to combat fleas and ticks). Whereas waste water from greenhouses used to be discharged directly into surface water - usually barely purified - today the emission route is increasingly through the sewage system. It is estimated that in 2018, 91 kg reached the surface water via wastewater treatment plants. It is difficult to estimate what proportion of this came from greenhouse horticulture, and what proportion from private households. It is notable that relatively high concentrations are found at wastewater treatment plants that are not located in greenhouse horticulture areas. This implies that imidacloprid emissions as a result of use for animals are a substantial source.

Fipronil

This is also the case with the insecticide fipronil, which is used only for pets. From monitoring data, it was calculated that in 2018, 22 kg of fipronil reached the surface water via wastewater treatment plants. Provisional rough emission estimates were recently made for both fipronil and imidacloprid, based on application scenarios (Lahr et al., 2019). According to these scenarios, the loads for both substances calculated via Watson would be more than sufficient to exceed the standard for both substances. The use of veterinary medicines in pets will be further elaborated in the coming years in the theme 'Veterinary medicines: sources, routes and risks' within the Kennisimpuls Waterkwaliteit (Water Quality Knowledge Impulse) (see the Kennisimpuls Waterkwaliteit website).

Herbicides on paving

Herbicides such as glyphosate are also regularly found in domestic wastewater. Glyphosate is rapidly converted into aminomethyl phosphonic acid (AMPA) in the environment, which means that the glyphosate concentrations measured underestimates the actual emissions Additionally, these substances may be used by both private individuals and public authorities, which makes the use of monitoring data less appropriate. Public authority use of herbicides on paved surfaces and in public green spaces has become severely restricted in recent years; private individuals are still permitted to use these products without restriction. In 2019, the CBS (Statistics Netherlands) and the RIVM (National Institute for Public Health and the Environment) published new figures on use by public authorities and private individuals. Based on this, we made new estimates for these agents. These estimates reveal that the emission of a substance such as glyphosate by private individuals (3,172 kg) is many times higher than use by public authorities (2 kg) and the agriculture sector (37 kg).

Conclusions

The monitoring data obtained from regional water managers, collated in the Watson database, are a good basis for estimating emissions for these substances. This can provide additional information about emission routes that is difficult to identify in other ways. With the most recent update to the Watson database, it has also become possible to derive trends for some (groups of) substances from the series of measurements. As a result, it is possible to evaluate the effectiveness of policy measures.

Erwin Roex
(Deltares)
Nanette van Duijnhoven
(Deltares)
Rianne van der Meiracker
(Deltares)
Jos van Gils
(Deltares)
Anja Derksen
(AD eco advies)

Summary

The Watson database collates monitoring data from water managers concerning micropollutants in influent and effluent from wastewater treatment plants. These data can serve as input for emission estimates for substances. These estimates can provide information regarding the origin of micropollutants that are hard to assess using other methods, as this article demonstrates for (the personal use of) over-the-counter pharmaceuticals for humans and pets. With the most recent update to the Watson database, it has also become possible to derive trends for some (groups of) substances, such as PFAS, from the time series of measurements: a useful tool for evaluating the effectiveness of policy measures.


References


Lahr et al.(2019) Diergeneesmiddelen in het milieu, een synthese van de huidige kennis. STOWA report 2019-26

www.cbs.nl/nl-nl/nieuws/2019/35/gebruik-bestrijdingsmiddelen-overheden-fors-gedaald

www.emissieregistratie.nl/erpubliek/erpub/wsn/default.aspx

www.kennisimpulswaterkwaliteit.nl

www.rivm.nl/publicaties/particulier-gebruik-biociden-2014-2017

^ Back to start

WATSON DATABASE

The most recent update

Knowledge journal / Edition 1 / 2020

Wastewater-based epidemiology: Wastewater as a reflection on society

In 2005, Italy became the first country to use a new method to measure the use of drugs in a city. The source: chemical analysis of sewage. The success of this study at once made it clear that sewage can provide a wealth of information about a population’s health and lifestyle.

All kinds of chemicals and microorganisms enter the sewage system via the human body, or via direct discharge, and then go onto the sewage purification system. Key to sewage epidemiology, or wastewater-based epidemiology (WBE), is the identification of biological markers (biomarkers). These can be chemical substances (that for example indicate consumption, use or exposure) or pathogens (bacteria, viruses or their genetic material). A biomarker is useful if it is excreted by humans, ends up in the sewage in detectable quantities, has no other relevant sources, and is stable. Research into drugs use among the population is the best-known application.

WBE step by step

The first step is to take samples, which involves collecting sewage daily every 5-15 minutes and mixing it to form a single aggregate sample. This is necessary because the composition of the sewage can vary enormously throughout the day. The sample is processed, and possibly extracted and concentrated to optimise measurement of the biomarkers. The concentration detected is then multiplied by the flow (the volume of water that flows through the sewage treatment plant), so that the biomarker load is known. In the case of drugs, usage per day per 1,000 inhabitants can be calculated by correcting the load for human excretion and dividing it by the number of people in the catchment area. Conversion to the number of doses per 1,000 inhabitants is also possible. See figure 1 for a diagram of the steps and an example of a calculation.

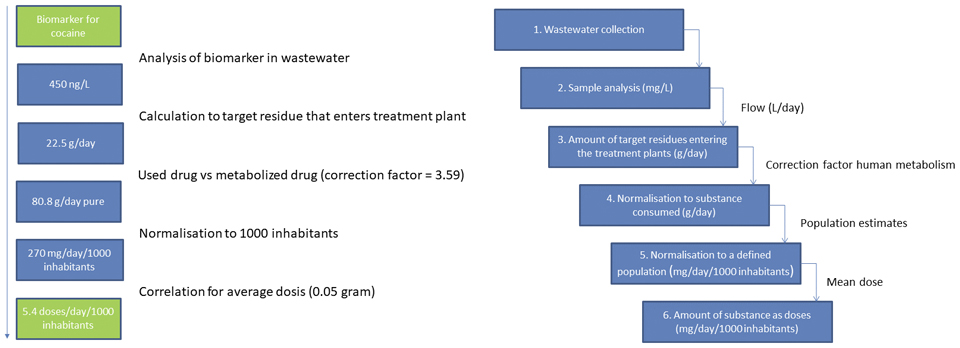
Figure 1: The key steps in analyzing sewage in wastewater epidemiology (WBE) and the required data per step (according to Castiglioni et al., 2014), with an example of a calculation.

Size of the population

With WBE, it is important to standardise the data for the size of the population. The official number of inhabitants in a catchment area is often not up-to-date with respect to births and deaths, although these variations are small. Far more important is the influence of people’s mobility for work, entertainment or holidays. It is therefore unclear how many people per day or even per hour discharge their biomarkers into a particular sewage network. This can be corrected by working with ‘population biomarkers’. These are biomarkers whose excretion has a strong correlation with the size of the population, and that are independent of abiotic factors such as the weather and the geographical location. If the average emission of such a population biomarker is known for an individual, the number of people in the catchment area at a given time can be calculated. Common population biomarkers are sweeteners and ammonium.

Current applications of WBE

WBE was first used in Italy in 2005 to measure the use of illegal drugs. This study looked at cocaine, THC, ketamine, MDMA and heroine, and humane metabolites of these substances. WBE was subsequently also used to determine the use of, for example, caffeine, nicotine, slimming aids and alcohol. It has also proved possible to detect the use of new psychoactive substances (new drugs) and trace waste discharges from drug production in this way (Choi et al., 2015). Examining sewage also allows a differentiation to be made between the legal and illegal use of, for example, pharmaceuticals. For example, it was shown that in various cities in the Netherlands, only one third of the Viagra used was obtained legally with a doctor’s prescription (Venhuis et al., 2014).
When using WBE, the influence of environmental factors on the measurements is important. One example is the increase in the nicotine load during periods of rain. This turned out to be due to the transport of ashes and cigarette butt remains through the rainwater to the sewage system. As well as what people consume, substances to which people are exposed in other ways were also considered. These might include pesticides, mycotoxins, parabens, plasticisers, fire retardant substances and UV filters. The means of exposure varies, but biomarkers of all these substances can be found in sewage. Exposure can then be related to location (close to industry, for example) and to trends in time (think, for example, of the seasonal use of pesticides).

The European network of sewage analysis, Sewage analysis CORe group Europe (SCORE), has shown that it is also possible to measure drugs use systematically and on a large-scale. This network coordinates international studies and ensures quality control. This enables research to be carried out using the same validated methods, yielding robust and comparable results. These data are then also used annually by the European Monitoring Centre for Drugs and Drug Addiction. In 2011, this allowed illegal drugs use in 19 European cities to be compared for the first time. Since then, the measurement network has been extended to almost 120 cities within Europe and beyond (González‐Mariño et al., 2020).

Future

A broad range of biomarkers in the wastewater can tell us a lot about a particular population in almost real-time and with a high geographical resolution. This could be about behaviour (drugs use or eating habits, for example), exposure (to pesticides and industrial substances, for example) and health (pathogens or resistance to antibiotics, for example). The majority of studies into biomarkers are still academic and exploratory in nature. In the future, the analysis of sewage will be capable of delivering a wealth of socially-relevant information.
WBE can thus serve as a gauge of the population’s health. For example, it provides information about a population’s diet and the use of medications. For antibiotics, furthermore, this can be related to preventing resistance to antibiotics, because sewage contains bacterial resistance genes. Analysis of specific DNA fragments of pathogenic disease precursors can provide information about the spread of infections. Very recently, this technology was used to measure the incidence of SARS-CoV2, the virus responsible for CoviD-19, in various cities in the Netherlands (H2O/Waternetwerk, 2020). Analysis of sewage can thus provide a useful tool to monitor the outbreak of a virus on various geographical scales and even, if the resolution of the technologies is sufficient, to detect a virus in a population at an early stage.

Linking to other data

In all instances, it is important that the methods used are robust and reliable, but also that data from the examination of sewage are linked to other sources of information about the catchment area of sewage treatment plants so that correlations can be drawn. In the case of drugs production, this involves information from the police and investigative services. WBE can also be applied at events. For example, it can be used to look at alcohol and drugs consumption at a festival or the use of performance enhancers at a (non) professional sporting event. With regard to resistance to antibiotics, it is about a relationship between the use of antibiotics on the one hand, and the detection of infections with resistant bacteria in patients on the other hand. It thus becomes a little easier to detect antibiotic resistance in a population.

Conclusion

All in all, our sewage is an almost inexhaustible source of information about our behaviour and our health, without infringing privacy. By combining this information with, for example, population studies or health statistics, we can learn more about ourselves. Post-2005, an increasing amount of research was carried out into this method, and the number of studies continues to grow. Applications of WBE and the number of biomarkers studied have thus also expanded considerably in recent years.
WBE provides the water boards with an important source of information that is relevant in terms of testing and shaping policy. Governments at all levels, including their implementing organisations in the fields of public health, the environment and enforcement, can use this information to their benefit (Verhoeven et al., 2020).

Ruud Steenbeek
(KWR)
Peer Timmers
(KWR)
Thomas ter Laak
(KWR)
Erik Emke
(KWR)
Frederic Béen
(KWR)

Summary

Wastewater-based epidemiology (WBE) uses sewage as a source of information about citizens’ health and lifestyle. Analysis of sewage can provide information about the use of drugs and medications, the consumption of foodstuffs and other products and about exposure to, for example, pesticides in the catchment area of a sewage treatment plant. The monitoring of pathogens is also possible. Research into such ‘biomarkers’ was first carried out in 2005 for illegal drugs, but then quickly expanded. Wastewater appears to reflect society. Standardising the data for the population allows for comparison between different regions. Such information can help public authorities to test and improve policies.


References


Castiglioni, S., Thomas, K. V., Kasprzyk-Hordern, B., Vandam, L., & Griffiths, P. (2014). Testing wastewater to detect illicit drugs: state of the art, potential and research needs. Science of the Total Environment, 487, 613-620.

Choi, P. M., Tscharke, B. J., Donner, E., O'Brien, J. W., Grant, S. C., Kaserzon, S. L., ... & Mueller, J. F. (2018). Wastewater-based epidemiology biomarkers: Past, present and future. TrAC Trends in Analytical Chemistry, 105, 453-469.

González‐Mariño, I., Baz‐Lomba, J. A., Alygizakis, N. A., Andrés‐Costa, M. J., Bade, R., Bannwarth, A., ... & Bijlsma, L. (2020). Spatio‐temporal assessment of illicit drug use at large scale: evidence from 7 years of international wastewater monitoring. Addiction, 115(1), 109-120.

“KWR Vindt Coronavirus in Rioolwater En Werkt Aan Ontwikkeling Screeningstool.” H2O/Waternetwerk, 24 Mar. 2020, www.h2owaternetwerk.nl/h2o-actueel/kwr-vindt-coronavirus-in-rioolwater

Venhuis, B. J., de Voogt, P., Emke, E., Causanilles, A., & Keizers, P. H. (2014). Success of rogue online pharmacies: sewage study of sildenafil in the Netherlands. BMJ: British Medical Journal (Online), 349.

Verhoeven, M et al. (2020). Hoogheemraadschap de Stichtse Rijnlanden. Consulted on 16 March. Personal communication.

^ Back to start

ANALYSE SEWAGE

Wastewater reflects society

Knowledge journal / Edition 1 / 2020

Meuse basin example

Determining the origin of pollutants across management boundaries

Excesses above the standard of some substances in the river Meuse cannot be explained by the direct feed flow from abroad (via Eijsden) and the activities within the Directorate-General for Public Works and Water Management's own management area. The Directorate-General for Public Works and Water Management needed a better understanding of the load of substances from regional waters. The same question was equally relevant for the regional water managers considering their mutual load and that from foreign regional waters. A method was needed to trace the origin of pollutants.

We used a model that links emissions data from the Netherlands Pollutant Release & Transfer Register to the hydrology from the Water Framework Directive (WFD) Explorer (see box). This enabled us to calculate the concentration of a substance at any given location. We then compared the results with measurements, and optimised the model based on this. It was essential to include knowledge about the sources and the behaviour of substances in this optimisation. Virtual ‘tracers’ are used to determine the source of a substance at any given location. These tracers can be used to determine which management area and what source type the substance originated from.


WFD Explorer

The WFD Explorer analyses the effectiveness of potential WFD measures and packages of measures on the chemical and ecological quality of surface waters. The tool thus provides insight into how WFD objectives can be achieved. Examples of measures include tackling point sources (such as wastewater treatment plants) and diffuse sources (such as agriculture and traffic), stream re-meandering or the construction of near-natural riparian zones.
See also www.deltares.nl/en/projects/water-framework-directive-explorer.


Establishing the model

We developed and optimised the method using four substances (Osté and Altena, 2019): carbamazepine, fluoranthene, cobalt and zinc. These substances vary in chemical properties and use, and the available information is not the same for all four. Most is known about zinc: sources and measurement data. In the case of cobalt, for example, data on discharges to surface water are incomplete, mainly because leaching from the ground is not known. For carbamazepine, we have a fairly accurate understanding of the scope of the sources, but there are few monitoring data. Atmospheric deposition is the main source of fluoranthene.
The use of virtual tracers enables the model to be used to estimate the origin and scope of sources or to estimate the locations where the highest concentrations can be expected

The WFD Explorer Meuse schematisation (Meijers, 2018) was used for the calculations. Based on data from the Emissions Register (Netherlands Pollutant Release & Transfer Register, 2019) point sources and diffuse sources of zinc, cobalt, carbamazepine and fluoranthene were added to this schematisation. These point sources relate to industrial and municipal wastewater treatmentplants; they have been imported in the WFD Explorer at the location of their discharge point. In addition to these internal sources, the smaller waters in the Meuse basin that cross management borders are also important. For these water bodies, a concentration for the respective substances was determined on the basis of measurement data at or close to the boundary point. The water managers provided monitoring data in this respect.

Retention

For zinc, the loads of foreign water bodies can be calculated and all national sources are recorded in the Emissions Register. Furthermore, the water managers monitor zinc at a lot of locations, which means that there are plenty of validation points available. Zinc was therefore a good candidate to test and calibrate first within the model. It appears that the zinc concentrations calculated are considerably higher than the concentrations measured (figure 1). This applies not just to larger water bodies, but also to local waters. Since a lot of research has already been conducted into all point sources, we assume that the emissions are correct. We concluded that zinc ‘disappears’ via retention in small waters, i.e. the sequestration of substances in, among other things, the sediment. A retention factor was calculated based on the difference between the measured and the calculated concentrations in the small waters. Calculation with the retention factor in small waters also resulted in higher zinc concentrations for the larger waters that were more in line with actual measurements.

‘Statistical estimation’ of sources

Whereas a lot of data are available for zinc, some of the information regarding monitoring data and sources is missing for a lot of other substances. For cobalt, for example, a lot of measurements are available, but knowledge about the sources is lacking. These calculations resulted in considerably lower concentrations than the measured values (figure 1). The main reason is probably that cobalt leaching from soils is not recorded in the Emissions Register, and that this source is therefore not included in the calculation. To enable leaching to be modelled, this was estimated on the basis of the difference between the measured and the modelled concentrations. The spatial distribution in regional waters of this concentration difference can provide information on differences in the intensity of leaching. This allows us to estimate a source for which there are no emission figures available. Based on the difference in measured and modelled concentrations, leaching is estimated at 11 grams/ha/annum. This value is applied uniformly across the whole Meuse basin.

Figure 1. Comparison of measured (x-axis) and calculated (y-axis) values for the modelled substances For cobalt and zinc, the open circles are from before calibration (‘statistical estimation' or retention) and the filled circles are from afterwards. Due to the space limitation, the results for fluoranthene are not presented here.

Adjusting the monitoring network


Sources for the medicine carbamazepine are well known (wastewater treatment plants and domestic wastewater via septic tanks), but the volume of measurement data is very limited. Therefore, a model calculation using data from the Emissions Register was performed for this substance, with no further adjustment of the model (see figure 1). For water bodies for which there is little or no measurement data on a specific substance, the tool provides an initial indication of expected concentrations. This can help to decide on the locations where it is useful to monitor, for example because high concentrations are expected at a specific intake point. This is subject to a degree of retention and/or decomposition being known.

Analysis of source to map out shifting

The method developed has been applied to the Dutch Meuse river basin for four substances. The calculations from the model indicate that the regional load on the Meuse at Keizersveer (just before the Biesbosch) is greater than the foreign load from Belgium entering at Eijsden. Regional sources thus make up a large part of total load. Furthermore, the concentrations in the regional waters are higher because the flow is relatively small there (figure 2). It should be noted, however, that a large proportion of this inland load originates from regional cross-border waters. The amount from the Brabantse Delta Water authority is very small because this water authority mainly drains into the Meuse after Keizersveer. Also mixing with Rhine water takes place in that area.

In terms of zinc and cobalt concentrations, there is an upwards trend between Eijsden and Keizersveer; for fluoranthene, conversely, a clear decline is visible. In all cases, the method developed can be used to state whether the increase or decrease is domestic or from abroad. One of the practical implications of this is that the method developed can be used to make shifts visible, and that any exceeding of the standards can therefore not be solved within the respective water manager’s management area alone.

Figure 2. Origin of the load into and the flow from the Meuse at Keizersveer, by water manager and flow type The flow from abroad is thus allocated to the water manager where the foreign body of water enters the Netherlands. Due to the space limitation, the test data for fluoranthene are not presented here.

Quantifying the effect of measures

Determining the origin provides transparency into the relevant source(s), and thus provides an indication of potential measures. The model can also be used to quantify the effect of a potential measure. There are different types of measures that can be calculated, such as locally or regionally reducing diffuse sources, adjusting point source emissions or adding settling pits to the water system. As an example, the effect on the Meuse of a 90% reduction in carbamazepine emissions by all the wastewater treatment plants in the De Dommel Water Authority was calculated (figure 3).

Figure 3. Effect of a hypothetical measure (90% reduction in carbamazepine emissions by all wastewater treatment plants in De Dommel Water Authority) on concentrations of carbamazepine in the Meuse calculated using the model

Conclusions

The method developed – linking the WFD Explorer model (hydrology) and the Netherlands Emissions Register (emissions) – yields concentrations of substances that are not always in line with measurement data and what is known about sources. For the calibration step, the model uses knowledge about the behaviour of substances, depending on the available information:
1) retention or supply to the water system (if information about sources and concentrations is easily available);
2) ‘statistical estimation’ of sources (if knowledge of the sources is incomplete and the model underestimates the concentrations measured).
If there are little monitoring data available, but there is reliable information regarding sources, the model results provide an initial indication of the concentrations that can be expected at a location.
The model can also provide quantitative predictions regarding the (change in) concentrations when emission-reducing measures are implemented.
Furthermore, by using virtual ‘tracers’ at any desired location, the model can indicate the site of the sources that are responsible for the substance concentration found; a useful tool for engaging in conversation with other managers.

Wilfred Altena
(Deltares)
Leonard Osté
(Deltares)
Hannie Maas
(Rijkswaterstaat)
Noud Kuijpers
(Programmabureau KRW/DHZ Maasregio)

Summary

Water managers are generally focused primarily on the sources of contamination in their own water system, but it is sometimes desirable to have insight into sources elsewhere. This article describes a new method to identify the load from upstream waters to a point downstream. The method makes iterative use of a water quality model (hydrology, emissions) and concentrations measured in the surface water. The model can determine the origin - spatially, according to source type and quantity - for each substance at any location. As such, the method is useful in the collaboration between water managers, in the search for measures to improve water quality, and in the predictive quantification of the effects of measures.


References


Osté, L. and Altena, W. (2019). Ontwikkeling methode afwenteling stoffen in het Maasstroomgebied, Deltares rapport 11203432-002-ZWS-0003.

Meijers, E. (2018). Verbetering hydrologische schematisatie KRW-Verkenner Maas t.b.v. bronnenanalyses, Deltares memo.

Nederlandse EmissieRegistratie (Netherlands Pollutant Release & Transfer Register), www.emissieregistratie.nl, consulted: 13-02-2019.

^ Back to start

MEUSE BASIN EXAMPLE

Determining origin of pollutants

Knowledge journal / Edition 1 / 2020

Removal efficiencies of pharmaceutical residues at 18 wastewater treatment plants

A measurement campaign at 18 wastewater treatment plants in the east of the Netherlands provides insight into the removal efficiencies of pharmaceutical residues. The 11 guide substances reveal an average removal of around 30%.

Virtually all surface waters in the Netherlands contain traces of micro-pollutants: pharmaceutical residues, plant protection agents, household chemicals and industrial contaminants. These substances are in low concentrations, varying from a few nanograms to micrograms per litre.
Although the concentrations are low, there is growing evidence that these substances negatively impact the aquatic environment. A large portion of the micro-pollutants in surface water is directly related to effluent discharges from wastewater treatment plants (Moermond et al, 2016).
Wastewater treatment plants remove these substances to varying degrees, ranging from 0% and 99%. This is in part dependent of the properties of the substance ( Watson database, Maas et al., 2018, and in comparison with STOWA 2018-02, STOWA 2018-46). The removal efficiency for specific substances can vary enormously per wastewater treatment plant (Maas et al, 2017).
This article is the follow-up to a publication in the previous issue of Water Matters (September 2019). That article described a measurement campaign that was designed to determine the impact of pharmaceuticals discharged from seven wastewater treatment plants operated by the Aa en Maas Water Authority (Evenblij et al, 2019).
This article briefly describes the insights into the removal efficiencies obtained during a measurement campaign at 18 wastewater treatment plants in the east of the Netherlands. It looks specifically at the results of removing pharmaceutical residues, and not at the other organic micro-pollutants measured.

Two research questions were developed prior to the study:
1. What is the removal efficiency of the micro-pollutants?
2. Are there any simple process parameters that can influence the removal efficiency?

The measurement campaign was carried out at 18 wastewater treatment plants in the management areas of five water boards: Drents Overijsselse Delta, Zuiderzeeland, Vallei en Veluwe, Vechtstromen and Rijn en IJssel. In February and July 2018, three 48-hour samples of influent and effluent were taken from these wastewater treatment plants. The samples were taken in a period of dry weather, over a period of approximately 10 days.
An analysis package was established for the project, comprising organic micro-pollutants, macro-parameters and metals. When compiling the package of substances, account was taken of problem substances that occur in the surface water, the RWS draft list (2017) with 11 (recommended) 'guide substances' and 'other substances relevant for monitoring effluents', the substances measured within comparable projects such as the PACAS project at the Papendrecht wastewater treatment plant and substances that are prominent in the Watson database.
Next, the available budget was used to align as far as possible with standard laboratory analysis packages. A deliberate decision was made in favour of ‘limited’ analysis of the number of micro-pollutants to allow for more frequent measuring.
This study did not consider the effects on the water system.

Analysis of pharmaceuticals

The pharmaceuticals were analysed using positive ionisation liquid chromatography–mass spectrometry (pos-LC-MSMS). Of these, 57 pharmaceuticals and two metabolites were determined. The effluent samples were taken by elution with added labelled internal standards without additional dilution, and injected into the LC-MSMS by direct injection. The influent samples were first diluted five times to reduce matrix effects, and subsequently measured in the same way as the effluent samples. The analyses were carried out by Aqualysis.

Results

The influent concentrations of pharmaceutical residues measured at the 18 waste water treatment plants examined varied from below 0.1 µg/l to hundreds of µg/l. The total amount of the 59 pharmaceutical residues analysed in the influent was on average 464 µg/l. More than 75% of the load comprised paracetamol (painkiller) and metformin (controls the blood sugar). In effluent from the wastewater treatment plants, the total concentration was considerably lower (21.1 µg/l), and there is also a different ‘top 11’ here than in the influent (figure 1).

Figure 1 (a and b) Pharmaceutical residues in wastewater treatment plant influent and effluent, in micrograms per litre. The substances mentioned by name are those with the highest concentrations, averaged across 18 wastewater treatment plants. The numbers are the average concentration per substance.

Although a waste water treatment plant effectively removed metformin, the effluent concentration measured was still greater than 1 µg/l. The total removal efficiency across the total load of pharmaceutical residues was over 90%. This removal is largely influenced by the high load of the easily removable substances metformin and paracetamol. Without these two substances, the total load removal of pharmaceutical residues would be between 60-85%, depending on the wastewater treatment plant.

Removal of guide substances

The Micro-Pollutants Innovation Programme was established by STOWA in collaboration with the Ministry of Infrastructure and Water Management. This programme uses 11 guide substances to evaluate the effectiveness of the removal techniques. The average removal efficiency of these 11 guide substances, as derived from the measurement campaign, are presented in figure 2.

Figure 2 Average removal efficiency of the 11 guide substances from the Micro-Pollutants Innovation Programme, per wastewater treatment plant.

The average removal efficiency per wastewater treatment plant varies from 9% to 53%. Overall, across all 18 wastewater treatment plants, the average efficiency for the 11 substances is around 30%. In both the summer and the winter period, several substances regularly returned a negative removal efficiency: 22 in the summer and 37 in the winter. This demonstrates that a number of substances in the influent were not measured or were insufficiently measured, while those in the effluent can (apparently) be measured more accurately. It is also possible that a substance in the influent is included as a non-measured metabolite and is thus ‘invisible’, to then appear at the wastewater treatment plant as the parent component, which was measured, after the conversion processes.

Loads and concentrations of the substances from the ZORG project

In 2011, an inventory was completed of the emission of pharmaceuticals from care institutions (STOWA 2011-2). The study looked at the supply and emission of 25 substances at eight wastewater treatment plants. In the study, the average removal percentage for the substances measured at the time (excluding metformin) (total load removal) was 65%.
By comparison, this percentage for the 18 wastewater treatment plants in this study was also calculated and presented in figure 3 (the blue bars). The average removal efficiency was 78%, which is significantly higher than the 65% as measured in the ZORG project.

Figure 3 Comparison between total load removal and percentage reduction in concentration of the 25 substances from the ZORG project, for the 18 wastewater treatment plants considered in the Rhine-East area.

Figure 3 presents the removal of pharmaceutical residues in a different way, i.e. as an average removal percentage per substance. For this, the percentage reduction in concentration was calculated for each substance individually. Next, an average of these values was calculated for all the substances considered (in the same way as the calculation for the removal of the 11 guide substances): the green bars in figure 3. This was done for the same list of 25 substances from the ZORG project. On average, the concentrations of these substances in the effluent is 46% lower than in the influent.
Further, it appears that this approach shows (small) changes compared with the total load approach. Both approaches are necessary, however, to determine to what extent the discharge of pharmaceutical residues forms a risk for the receiving surface water.
That is a study in itself which involves a number of other factors, such as the function and quality of the surface water discharged to. With reference to the previous article about the measurement campaign at Aa en Maas Water Authority, it can be said that this type of measurement data provides input to determine a ‘ranking’ of wastewater treatment plants as further detailing of, for example, the Hotspot Analysis Pharmaceuticals at wastewater treatment plants, carried out in 2017.

Correlation between removal and operational characteristics of the wastewater treatment plant

In this project, a number of characteristics of the wastewater treatment plant are noted each time a measurement is taken so that possible connections can be made. The search here was focused on the correlation between the wastewater treatment plants’ process circumstances and the removal of pharmaceutical residues.
The following characteristics were analysed: temperature, hydraulic retention time, sludge age, quantity of heavy metals (with copper used as an indicator), and the presence of internal load from dewatering of digested sludge. The technological set-up of the wastewater treatment plant was also considered. As figure 3 shows, there is a wider distribution for the average removal than in the total load removal, such that the expectation was that any links here could be demonstrated more strongly. Therefore, the technological parameters mentioned are correlated to the average removal of the substances per wastewater treatment plant.
However, no statistically significant links were found between the parameters considered and the removal of pharmaceutical residues. The only significant relevant parameter appeared to be the temperature. In the summer period, the average removal efficiency across all the substances measured (excluding paracetamol and metformin) is 55%, and 32% in the winter.

Conclusion

A large level of pharmaceutical residues was found across all influents, ranging in concentration from less than 0.1 to hundreds of micrograms per litre. The average overall removal efficiency for micro-pollutants is highly dependent on the micro-pollutants considered, and whether the removal is calculated on the basis of the total load or on the basis of the average of the removal efficiencies for individual substances. Based on the average of efficiencies for individual substances, bigger differences were found between wastewater treatment plants than on the basis of the removal of total loads.
The 11 guide substances from the micro-pollutants innovation programme, which are also included in this study, reveal an average removal of around 30%. The performance of individual wastewater treatment plants ranges from 9% to 53% for the 11 guide substances.
The differences between wastewater treatment plants cannot be linked to simple technological parameters or the purification concept. It is possible that a wastewater treatment plant’s system configuration may influence individual substances or groups of substance; this was not examined in the study. The removal of micro-pollutants proved to be mostly strongly linked to temperature. A significantly higher removal efficiency was found in the warm summer period than in the cold winter.

Herman Evenblij
(RHDHV)
Els Schuman
(LeAF)
Melanie Kuiper
(Waterschap Drents Overijsselse Delta)

The data collated for this project can be requested from Drents Overijsselse Delta Water Authority.

Summary

Wastewater treatment plants are a source of micropollutants in surface water and show an inexplicable variation in the removal of these substances. In the management area of the 5 eastern water boards, the disposal efficiency for pharmaceutical residues has been investigated on 18 wastewater treatment plants. Efforts were also made to correlate the occurring differences to the current process parameters at the relevant wastewater treatment plants. A selection of 11 guide substances from the Micropollutants Innovation Programme has an average removal rate of 30%. The performance of individual wastewater treatment plants ranges from 9% to 53% for these guide substances. The differences between PCDs cannot be linked to simple technological parameters or the purification concept.


References


Evenblij, H., Schoffelen, N., Knoben, R., Hulst, W. v.d. (2019) Rangschikking RWZI's op basis van metingen aan geneesmiddelen, Water Matters 1 (9), 36-39.

Maas, P. van der; B. Bult; H. de Vries; O. Kluiving; 2017; Verwijdering van acesulfaam in rioolwaterzuiveringsinstallaties: wat bepaalt het verschil?, H2O, 17 July 2017

Moermond, C. et al, Geneesmiddelen en waterkwaliteit, RIVM, 2016-0111

Wubbels et al. Biologische fingerprinting biedt inzicht in verwijdering van medicijnen en zoetstoffen in RWZI’s see here

STOWA 2017-42 Landelijke Hotspotanalyse geneesmiddelen RWZI’s

STOWA 2018-46 Zoetewaterfabriek awzi de Groot Lucht: pilotonderzoek ozonisatie en zandfiltratie

STOWA 2018-02 PACAS – Poederkooldosering in actiefslib voor verwijdering van microverontreinigingen

Watson database in the emissions register; http://www.emissieregistratie.nl/erpubliek/erpub/wsn/default.aspx

^ Back to start

RESIDUES

Measurement campaign

Knowledge journal / Edition 1 / 2020

Drinking water conservation in the Netherlands: how can we change our behaviour?

The conscious and economical consumption of drinking water cannot be taken for granted. It is essential, however, because of the need to use vulnerable nature and available raw materials sustainably, and to reduce greenhouse gas emissions. Furthermore, water is scarce; the dry Dutch summer of 2018 was a wake-up call in this respect for drinking water companies. How logical it might seem to conserve drinking water, it’s easier said than done.

Despite the rise in sales of water-saving devices, domestic water consumption has decreased only slightly in recent decades (Van Thiel, 2017). It is therefore important to focus efforts on enhancing water conservation behaviour. Currently, water companies do this mainly by issuing drinking water advice during droughts. The question, however, is to what extent this advice is adhered to. What does it take to get people to actually use less drinking water? In this article, we set out the key insights into stimulating water-saving behaviour, based on an extensive study of the literature.

Knowledge transfer is not enough

The standard idea is that you have to inform people, for example about the negative consequences of a water shortage for the environment (Koop et al., 2019). As long as they have enough of an understanding, they will adopt a more positive attitude towards water-saving behaviour. However, a positive attitude still doesn’t mean that individuals personally want to save water. If no one in their social environment is concerned with saving water (negative social norm) and they don’t consider themselves as being knowledgeable about how they can save water (low estimation of own effectiveness), there is, in fact, little chance that they actually want to save water.

Where there’s a will, there’s a way?

In stimulating behavioural change through knowledge transfer, one of the presumptions is that people make more or less well-considered decisions about their behaviour. But that is by no means always the case. For instance, the intention to take shorter showers often does not result in taking shorter showers in practice.
One of the reasons why intentions often fail to result in action is that many of our daily choices are made virtually without thinking. There are two systems in the brain that, to a greater or lesser degree, are active: system 1 is a fast system, based on emotion, impulse or habit. It is also known as our automatic brain, because we have no control over it. System 2 is a slower and more reflective system based on cognition and the consideration of choices (Kahneman, 2012). Thinking in accordance with system 2 requires a lot of brain energy. Due to a lack of time, mental energy or capacity, our brains generally operate based on system 1. Two behavioural influencing tactics that focus on well-considered choices are (I) increasing knowledge and (II) increasing perceived behavioural control (Koop et al., 2019). These tactics – which for example come together in the current recommendations for conserving water - may well influence attitudes towards water conservation, but often fail to result in actual behavioural change.

Taking advantage of automatic decision-making

Most daily choices in relation to water consumption are made almost completely unthinkingly and automatically (system 1). The quick decisions that people make in these circumstances are often based on simple rules of thumb (Kahneman, 2012). In addition to behavioural influencing tactics that respond to well-considered choices (system 2), there are also various tactics that respond to a greater or lesser extent to the virtually completely automatic, impulsive route (system 1). The tactics studied that respond to this route of conserving water are framing, social norms, tailoring, emotional shortcuts, priming and nudging (Koop et al., 2019).

Framing: how do you present the message?
Framing makes use of subconscious errors in our thinking, for example the tendency to see things we need to tackle in the short-term as important, while paying hardly any attention to more important things in the longer-term. Accordingly, experiments have shown that people are more open to messages about the direct short-term effects of water shortages than about the indirect long-term effects that are more far-reaching (Zhuang et al., 2018).

Social norms: how do other people behave?
Social norms reveal what other people are doing. For example: ‘Most people choose a water-saving dishwasher’. This type of information also works as a simple rule of thumb for making a choice that requires no reflection. Where people make quick, almost completely automatic choices, social norms can stimulate water conservation. Up until now, applying social norms appears to be one of the most effective behavioural influencing tactics with respect to conserving water (Koop et al., 2019).

Tailored feedback reveals subconscious patterns
Tailoring relates to getting the message to resonate with the recipient so that the he or she is more likely to feel personally addressed, and to process the message more consciously (via system 2). In the Netherlands and abroad tailoring is used widely to provide feedback on water consumption through the installation of smart water meters. People often believe they are more economical in their use of water than is actually the case. This leads to a feeling of discomfort, and an incentive to save more water (Cialdini et al., 2006). In the literature this mechanism is referred to as cognitive dissonance.

Emotional shortcuts: responding to feelings
People's responses to different messages can be influenced by evoking emotions. For example, an experiment in which small feedback screens were placed in showers, demonstrated that a visualisation of a swimming fish that dies when you use too much water is more of an incentive to save water than a presentation of water consumption with figures or drops (Fang & Sun, 2016).

Priming: activating a mind-set
Exposure to a prime – i.e. an external stimulus, for example words or a smell – influences the response to a subsequent stimulus because a certain mind-set or goal has been activated. Priming environmentally-conscious goals thus results in increased appreciation of, and choice in favour of, loose rather than packaged products (Tate et al., 2014). As far as we know, primes have not yet been used for water conservation.

Nudging: a push in the water-saving direction
Nudging means cleverly designing the environment and range of choices to change people’s behaviour in a predictable way, without taking away options or restricting freedom of choice (Thaler & Sunstein, 2008). To this end, several of the tactics referred to above can be used. One well-known example is positioning healthy food products at eye level in the supermarket. In the same way, water-saving taps can be displayed prominently in DIY stores to stimulate sales. Indeed, there are many possible applications of this tactic.

The next steps towards more water-saving behaviour

The international literature on domestic water conservation shows that there is a big difference between knowing, wanting and doing, and that a push in the right direction can help. Cleverly combining and repeating different behavioural influencing tactics appears to be the key to success. When drinking water companies issue water-saving tips during dry periods, it is important that they respond to the automatic, impulsive system in the brain. Subtle tactics can make water-saving behaviour the obvious option. To-date, social norms and tailored feedback in particular appear to be effective.
The question is, however, what happens when behavioural influencing tactics are used over a longer period. For example, is placing an hourglass in the shower still effective a few months down the line? One interesting direction of research which KWR is fully committed to, is exploring how these forms of behavioural influence can help people to develop and maintain new water-saving habits.
The use of so-called ‘if-then plans’ is interesting in this regard. In an if-then plan, a specific situation is associated with a specific behaviour. For example: ‘If I am cleaning my teeth, then I will switch the tap off’. The thinking behind this is that the situation (cleaning your teeth) automatically triggers behaviour (turning the tap off) without having to think about it. The use of this approach is already delivering promising results in the area of pro-environmental behaviour (Gollwitzer & Sheeran, 2006).

Stefanie Salmon
(KWR Water Research Institute)
Stijn Brouwer
(KWR Water Research Institute)
Stef Koop
(KWR, Utrecht University)

Summary

Drinking water companies are increasingly issuing advice on how to save water during dry periods. The question is whether people follow this advice. What does it take to get people to actually consume less drinking water? This article presents eight behavioural influencing tactics from the international literature that have been used in the area of water conservation. Knowledge transfer alone, and increasing perceived behavioural control, do not appear to bring about sufficient change in behaviour. Subtle tactics that respond to the impulsive route are often more effective. For example, comparison with others can subtly stimulate someone to save water. Questions for follow-on research are what the effects of these subtle behavioural influencing tactics are in the long-term, and how water saving behaviour can become a habit.


References


Cialdini, R.B. et al. (2006). Managing social norms for persuasive impact. Social Influence, 1, 3-15.

Fang, Y.M. & Sun, M.S. (2016). Applying eco-visualisations of different interface formats to evoke sustainable behaviours towards household water saving. Behaviour & Information Technology, 35, 748-757.

Gollwitzer, P.M. & Sheeran, P. (2006). Implementation intentions and goal achievement: A meta-analysis of effects and processes. Advances in Experimental Social Psychology, 38, 69-119.

Kahneman, D., (2012). Thinking, Fast and Slow. London: Penguin.

Koop, S.H.A., Van Dorssen, A.J., & Brouwer, S. (2019). Enhancing domestic water conservation behaviour: A review of empirical studies on influencing tactics. Journal of Environmental Management, 247, 867-876.

Tate, K., Stewart, A.J. & Daly, M. (2014). Influencing green behaviour through environmental goal priming: the mediating role of automatic evaluation. Journal of Environmental Psychology, 38, 225-232.

Thaler, R. & Sunstein, C.R. (2008). Nudge: Improving decisions about health, wealth and happiness. Yele University Press, New Haven, United Kingdom.

Van Thiel, L. (2017). Watergebruik thuis 2016. TNS Nipo report C8732.

Zhuang, J., Lapinski, M.K., & Peng, W. (2018). Crafting messages to promote water conservation: Using time-framed messages to boost conservation actions in the United States and China. Journal of Applied Social Psychology, 48, 248-256.

^ Back to start

DRINKING WATER

How can we change behaviour?

Knowledge journal / Edition 1 / 2020

Integrated risk analysis: the next step in tackling flooding?

Water management in the Netherlands has traditionally covered three domains: safety (flood defences), urban water systems, and water systems for rural areas. Water boards, municipalities and provinces, and the national government, each play their own very precisely coordinated role in each domain. Increasing flooding caused by peak rainfall, for example in Kockengen in July 2014, has highlighted the limitations of this approach. Better collaboration and an integrated approach are needed.

In 2016, STOWA worked with the various public authorities and RIONED to form the Flood Committee. The aim is to look coherently at cross-sector tasks and to work towards more effective solutions with greater support, based on an integrated risk analysis. But is such an integrated risk analysis feasible, and will this lead to efficiency and a meaningful perspective for the manager(s)? HKV has worked with water boards and municipalities to investigate this in four cases, based on a uniform framework (STOWA, 2020).

Current practice

For each of the different water systems there are design rules and guidelines, which have traditionally been developed separately. For each water system, if the expected flooding and the expected damage increase (both the impact in euros as well as the spatial extent and non-material damage), the requirements are more stringent. These demands vary:
• for the urban water system, for example, it is deemed acceptable if there is water on the street every two years because the sewers are overloaded;
• different standards apply in rural areas. For example, flooding is acceptable once every five years for grassland, but only once every 30 and 100 years for arable farming and cultivated areas. These standards were developed at the time of the Committee on Water Management in the 21st century, partly on the basis of social cost-benefit analyses (SCBA), and adopted by the provinces;
• for primary flood defences, the flood probability standards are based on an SCBA and on the risks of casualties, and set out in the Water Act;
• For regional defences, the standard class depends on the damage in a polder following a breach. These standards, expressed as the probability of exceeding a water level and defined by the provinces, vary from once every 10 to 1,000 years (N.B.: such a standard is therefore not the same as the probability of a breach).

See it differently: the integrated view

An integrated risk analysis focuses on flooding caused by precipitation in a catchment area, whether urban or rural, or because of failure of flood defences. The term risk is key; it is defined as the product of the probability of occurrence and the consequences in an area. The probability of flooding is calculated on the basis of statistics on precipitation, storage and drainage options and the strength of levees. The consequences relate to the depth of flooding and the resulting damage (including the duration). This means that the design of the spatial environment and the crisis or management measures are also taken into account. Statistical, hydraulic, hydrological and damage models allow both the probabilities and the consequences of possible events - including interdependencies between water systems and measures - to be estimated, and with them the risk.

Example of Woerden and Oude Rijn

In the event of prolonged rainfall, the discharge of water from the polders into the Oude Rijn flood basin storage is stopped so as not to overload the flood defences. The milling stop (maalstop) results in additional damage in the polders. However, Woerden's urban water system also discharges into the flood basin storage via an overflow system. The threshold height of this overflow is above the milling stop level, to allow free discharge of urban water into the flood storage basin.
The integrated risk analysis showed that it is possible to dispense with the strict connection between the threshold height and the milling stop level. The calculated probability of simultaneous flooding due to extreme peak precipitation (in the city) and prolonged area precipitation (in the polders) proved to be zero. Due to the slow reaction speed of the regional water system during peak rainfall, the risk of an overflow becoming overwhelmed is minimal. The threshold height could thus also be lowered. This offers the city of Woerden scope: more opportunities to drain water, less water storage needed.
This example also highlights the need to focus on losses and damage modelling. An integrated risk analysis needs to include all relevant losses: not just the damage from flooding itself, but damage to crops due to high groundwater levels as well.
It further emerged that the calculation of urban damage may have been significantly overestimated. The Waterschadeschatter calculated damage for Woerden of 15-20 million euros given 80 mm of rainfall in one hour. In September 2018, 97 mm of rain fell in one hour. The damage reported to insurance companies and the damage known to the municipality was at most several tens of thousands of euros.

Example of Rijnland: compartmentalisation of the flood storage basin

The Rijnland flood storage basin houses some old structures that allow the canal system to be divided into compartments so that in an emergency, certain sections of the canals can be isolated. Plans are currently in place to set up a mobile compartmentalisation team that can create a compartment within a few hours.
The example shows that compartmentalisation, and certainly a mobile compartmentalisation team, can be effective, and can result in lower risks and lower standards for regional flood defences. Damage to the flood storage basin is considerably reduced the shorter the section of flood basin with a lower water level. There is also less damage in a polder following compartmentalisation because there is less water flowing into the polders. The costs of the required investment in crisis management outweigh the benefits that can be achieved. The effectiveness and efficiency increase even further if predictions regarding the weather, flood basin water levels and failure probabilities are applied. It is therefore sometimes worth investing more in crisis management, and creating a mobile compartment before a potential breach, even if the flood defences subsequently prove not to have been overwhelmed.
The integrated risk analysis also brought new insights. Until now, the standardisation of regional flood defences was based on the assumption that the flood storage basin would be emptied completely into the polder. Assuming compartmentalisation, the standard of the regional flood defences could be lowered by as much as 1 to 2 standard classes in some places.

Example of Breda

Breda, located in a sloping area, can experience flooding due to peak rainfall in the city or extreme drainage via the Molenleij stream. Both a system analysis and an analysis of precipitation patterns (see figure 1) show that here too, peak rainfall in the city and prolonged precipitation in the rural area do not reinforce one another, but can be seen as separate events. The economic risk in the city can be reduced with measures such as preventing water from flowing into the city through the sewerage system or by reducing the vulnerability of buildings to flooding.

Figure 1: Correlation between short-term and long-term peak precipitation from a 258-year series of precipitation data (10-minute values).

Example of ‘New building project’

This example concerned a fictitious building, for example a large new data centre in a grassland polder. The combination of change of function and the value of this building would in principle require interventions in the water (defence) system. The integrated risk analysis shows that in such a situation, it is not always effective to improve the flood defences alone. Measures in the water system, and measures in the design of the environment and crisis management can each be effective and optimal, depending on the characteristics of the area and the value of the building.

Conclusion

The examples demonstrate that integrated risk analyses are feasible, and can lead to lower risks and greater efficiency of investments. An area analysis using various models, statistics, correlations and expert knowledge enables the risks to be mapped out. This uses tools that are already being used across all sectors.
One point for attention is to apply the same assumptions and definitions for failure probabilities and consequences (i.e. risk parameters should be under the same denominator). Damage modelling should also be looked at. We advise also including damage to crops due to high groundwater levels and damage caused by a reduction in the water level in the flood storage basin. Finally, we recommend evaluating and reviewing the damage functions in urban areas.

Call for the area standard, a promising proposition

The attention paid to climate change, spatial adaptation and risk dialogues indicates that the current design philosophy is at odds with society's expectations. If the focus were on integrated risk and exposure, rather than on the requirements per water system, the risk dialogue would be much simpler. Looking at extreme precipitation in the city and in the rural area and at regional flood defences then becomes self-evident. These forms of flooding can be considered regionally, leaving scope for customisation. Primary flood defences need not be considered, because the nature and scope are quite different; in the case of primary flood defences there is also a significant risk of casualties and the policy is embedded nationally.
We call for the area standards to be applied on the basis of an integrated risk analysis, with two pillars, of which the most stringent is leading:
• effectiveness; based on optimisation of the total costs with SCBA;
• basic provision; acceptance limits per form of land use, based on combinations of exposure and probability. An example is shown in figure 2.

Figure2: Example of possible elaboration of the basic provisions component where different requirements are set for different water levels.

The ‘acceptable risk’ in an area can be established as a standard and as a design criterion. The joint public authorities can set this out and communicate it to citizens and companies. The public authorities can agree mutually who is responsible for which measure.
This provides opportunities for regional customisation and a lower threshold for new area developments. Governments can subsequently impose additional requirements for (special) buildings, certainly where the impact of these buildings failing is very high. Finally, building owners can independently make additional provision to limit the risks of flooding, for example through building management, design and construction.

Bas Kolen
(HKV)
Roel Bronda
(HDSR)
Ludolph Wentholt
(STOWA)
Robin Biemans
(STOWA)
Hanneke Vreugdenhil
(HKV)

Background picture:
Flooding in the Slotenbuurt district of Zegveld (ZH) in 2018.


Summary

Water management in the Netherlands has traditionally covered three domains: urban area, rural area and safety (flood defences). In designing and managing water infrastructure, we have always looked at these various water systems separately, which can lead to suboptimal solutions. Integrated risk analyses allow for a broader view of bottlenecks in the water system, and put exposure at the forefront. The big advantage is that policy is developed on the basis of acceptable risks of flooding in an entire (catchment) area. Such an integrated approach also allows area standards to be developed.


References


STOWA (2020). Integrated Risk Analysis final report. Report 2020-02, 103 pp. ISBN 978.90.5773.885.2.

^ Back to start

FLOODING

Advantage integrated risk analysis

Knowledge journal / Edition 1 / 2020

‘Green’ flocculants from wastewater: the knife cuts both ways

Large quantities of synthetic petroleum-based polymers (flocculants) are used every year in the treatment of surface and wastewater, and for the thickening of all kinds of slurries, which is expensive and environmentally unfriendly. Is there a cheaper and cleaner alternative?

Flocculants are used on a large scale for the aggregation of particles such as clay particles or organic matter, in order to promote the separation of these particles by means of sedimentation, flotation or membrane filtration. Examples include the treatment of surface water or as an aid in dredging activities. In many instances, anionic polymers are used as flocculants. Cationic polymers are frequently used to further thicken and dewater slurries such as sewage sludge from sewage plants.

Synthetic, petroleum-based polymers are generally used as flocculants, such as polyacrylamides and polyethyleneimines for example. The global market for this type of polymers amounts to 6 billion euro per annum, of which around half are anionic and half are cationic flocculants. Synthetic flocculants have a number of disadvantages associated with their production and application, including a high CO2 footprint and high costs. In addition, the toxicity of the degradation products/monomers and of the chemicals (such as formaldehyde) used in the production process, which may still be present in the product, also plays a role (Lee et al., 2014). This latter may prevent the reuse of the treated water or of the separated particle concentrate. These disadvantages explain the increasing interest in ‘green’ and biodegradable flocculants such as chitosan, cationic starch, polymers produced by plants, tannins, etc. But there are disadvantaged associated with this category of flocculants too: (1) there is limited availability of the raw materials, or these compete with food production, or (2) energy-intensive chemical modification is required, or (3) the end product is very expensive in comparison with synthetic flocculants.

Flocculants from industrial wastewater

Reason enough to start research into the production of biodegradable flocculants - from wastewater (figure 1). Because under the right conditions, micro-organisms are able to convert the organic matter in certain types of wastewater into large volumes of (extracellular) (bio)polymers, rather than breaking it down into H2O and CO2. Because these polymers generally have a high molecular weight and a high charge density, they should in principle be suitable for use as a flocculant. Wastewater is a still untapped source for these ‘green’ flocculants. Industrial wastewater is more suitable for use than domestic wastewater, for one because it generally has a less complex composition, and because the processing conditions are easier to control.
The principle was first tested with (simulated) wastewater from biodiesel production, which contains glycerol and ethanol as the main organic substances. This demonstrated that a broad range of process conditions is possible, but that the COD/N ratio and the sludge age in particular play an important role in stimulating the micro-organisms to produce sufficient quantities of the right polymers (Ajao et al., 2019). (COD = chemical oxygen demand, a commonly used measure of the amount of degradable (oxidisable) organic material in water; N = nitrogen, necessary for the growth of micro-organisms)

As an example: given a sludge age of just three days and a COD/N ratio of 100:1, no less than 50 to 60% of the COD in the wastewater was converted into extracellular polymers. These polymers mainly comprised polysaccharides with negatively charged carboxyl groups, a high average molecular weight (1-2 MDa) and a high charge density (3-5 meq g 1 at pH 7). It is interesting, and of great significance, that these polymer properties can be controlled on the basis of the COD/N ratio of the wastewater, the sludge age and the type of organic matter, i.e. the type of wastewater used as the raw material.

Figure 1. Production of extracellular polymers from wastewater to replace synthetic flocculants

A lot of oxygen and energy (aeration) are required for the degradation (oxidation) of the COD. Because a high fraction of the COD is converted into polymers, considerable savings are possible (approx. 30-40%). The amount of biomass produced also falls significantly (approx. 40-50%). So the knife cuts both ways: the contaminants in the wastewater are converted into a valuable end product, and considerable costs and energy savings can be achieved at the same time. Other types of industrial wastewater than biodiesel wastewater can also be used, provided the wastewater meets the following criteria: (1) it contains dissolved and readily biodegradable substrate (COD) and (2) the COD/N ratio in the wastewater can be controlled. Further research is required, but it is already clear that the properties of the polymer produced (chemical composition, molecular weight and charge) are highly dependent on the type of organic substrate in the wastewater.

Flocculation tests with clay suspensions

The flocculants extracted from wastewater were tested on clay suspensions. These contain naturally charged particles that repel each other and therefore form a sediment very slowly, if at all. Figure 2A shows an example of the flocculation activity (increased clarity) on a 5 g L 1 kaolinite suspension as a function of the flocculant dose. In this instance, the flocculants had been produced from biodiesel wastewater with a sludge age of three days with two COD/N ratios, namely 100:1 and 20:1. Even at a very low dose of 0.1 mg flocculant g 1 clay, the COD/N 100:1 flocculant achieved an activity of more than 90%, meaning it was not inferior to synthetic flocculants. At higher doses, the flocculation activity declined slightly.

Suspensions of montmorillonite yielded similar, and sometimes even better, results. This is a different clay type comprising even smaller particles (0.1 1 µm) than kaolinite (1 10 µm). The COD/N 20:1 flocculant had rather less of an effect, which can be attributed to the somewhat lower fraction of polysaccharides in the polymers. Tests with clay suspensions and flocculants from various types of wastewater further demonstrated:

● Flocculants produced from saline wastewater show better flocculation activity in saline conditions than in fresh water conditions, and vice versa;
● In comparison with synthetic flocculants, a broader range of doses with good flocculation activity is possible before destabilisation of the suspension occurs.

Experiments were also carried out to look at sedimentation at very higclay concentrations, which are more representative of dredging activities. Figure 2B shows that at doses of 0.1 0.3 mg flocculant g 1 clay, the effect on the sedimentation of a 200 g L 1 suspension was considerable, and a much lower volume of sediment was achieved.

Figure 2. Flocculation activity in kaolinite suspension (5 g L-1) at different doses of polymer produced from biodiesel wastewater with COD/N 100:1 and COD/N 20:1 (A) and the effect of COD/N 100:1 flocculant on sedimentation in 200 g L-1 kaolinite suspension (B).

Various applications

Apart from the flocculation tests with (clean) clay suspensions described in this article, trials are ongoing with genuine surface water, one of the aims being to see whether and how it might be possible to remove particle-bound phosphate, and to improve the microfiltration and ultrafiltration of surface water.
An entirely different application is for the removal and recovery of heavy metals by means of adsorption. In column experiments in which the (anionic) flocculants were immobilised on a carrier material, very large amounts of, for example, copper (562 mg g 1) and lead (1204 mg g 1) were successfully adsorbed (Ajao et al., 2020); the remaining concentrations remained below the detection limit. Of note is that these adsorption capacities are far higher than those of commercial ion exchangers. The columns could then be regenerated, whereby the metals were recovered and the columns could be reused.

Cationic flocculants for dewatering sewage sludge
The flocculants produced from wastewater are anionic, and thus in principle not suitable for dewatering slurries such as (municipal) sewage sludge. In most instances, a cationic polymer is needed. Therefore, a number of exploratory trials have been carried out whereby the polymers from biodiesel wastewater were made cationic with the help of a mild chemical process (a reaction with glycidyltrimethylammonium chloride (GTMAC) in the presence of NaOH). The initial experiments with algae and bacteria suspensions have yielded hopeful results. It is not yet known whether the cationic variant is also suitable for dewatering sewage sludge in terms of effectiveness, environmental impact and costs, but the next logical would be to investigate this more closely. It can be calculated that the 3,700 tonnes of synthetic flocculants used annually for dewatering municipal sewage sludge could easily be replaced by flocculants produced from Dutch biodiesel wastewater. That would be a perfect, financially attractive contribution to the circular economy, and thus merits further investigation.

Hardy Temmink
(Wetsus, European Centre of Excellence for Sustainable Water Technology / Environmental Technology, Wageningen University)
Victor Ajao
(Wetsus, European Centre of Excellence for Sustainable Water Technology / Environmental Technology, Wageningen University)
Harry Bruning
(Environmental Technology, Wageningen University)
Huub Rijnaarts
(Environmental Technology, Wageningen University)

Summary

In certain types of (industrial) wastewater and under certain process conditions, micro-organisms can convert a considerable proportion (50-60%) of organic contaminants in wastewater into polymers. These polymers have a high molecular weight and high charge density, which means they are suitable as anionic flocculants and as adsorbents for (heavy) metals. The key benefits: the contaminants in the wastewater are converted into a valuable product that is more environmentally-friendly than standard synthetic variants, and at the same time yields considerable purification cost savings. The knife thus cuts both way.


Acknowledgements


The authors would like to thank the members of the ‘Natural Flocculants’ Theme of Wetsus, European centre of excellence for sustainable water technology, for the discussions and the financial support.


References


Ajao, V., Millah, S., Gagliano, M. C., Bruning, H., Rijnaarts, H., & Temmink, H. (2019). Valorization of glycerol/ethanol-rich wastewater to bioflocculants: recovery, properties, and performance. Journal of hazardous materials, 375, 273-280.

Ajao, V., Nam, K., Chatzopoulos, P., Spruijt, E., Bruning, H., Rijnaarts, H., & Temmink, H. (2020). Regeneration and reuse of microbial extracellular polymers immobilised on a bed column for heavy metal recovery. Water Research, 115472.

Lee, C. S., Robinson, J., & Chong, M. F. (2014). A review on application of flocculants in wastewater treatment. Process Safety and Environmental Protection, 92(6), 489-508.

^ Back to start

‘GREEN’ FLOCCULANTS

Cheaper and cleaner alternative

Archive


Edition 2/2019


Edition 1/2019


Edition 1/2018


Edition 2/2017


Edition 1/2017


Edition 2/2016


Edition 1/2016


Edition 2/2015


Edition 1/2015

ARCHIVE

Previous editions

Knowledge journal / Edition 1 / 2020

ABOUT WATER MATTERS

The knowledge section Water Matters of H2O is an initiative of


Royal Dutch Waternetwerk
Independent knowledge networking organisation for and by Dutch water professionals.


Water Matters is supported by

ARCADIS
Global natural and built asset design and consultancy firm working to deliver sustainable outcomes through the application of design, consultancy, engineering, project and management services.


Deltares
Independent institute for applied research in the field of water, subsurface and infrastructure. Throughout the world, we work on smart solutions, innovations and applications for people, environment and society.


KWR Watercycle Research Institute
Institute that assists society in optimally organising and using the water cycle by creating knowledge through research; building bridges between science, business and society; promoting societal innovation by applying knowledge.


Royal HaskoningDHV
Independent international engineering and project management consultancy that contributes to a sustainable environment in cooperation with clients and partners.


Foundation for Applied Water Research (STOWA)
Knowledge centre of the regional water managers (mostly the Water Boards) in the Netherlands. Its mission is to develop, collect, distribute and implement applied knowledge, which the water managers need in order to adequately carry out the tasks that their work supports.

ABOUT WATER MATTERS