CONTENTS

Knowledge journal / Edition 1 / 2019

PREFACE

Water Matters: research with a view to a practical application

In front of you is the eighth edition of Water Matters, the knowledge magazine of the journal H2O. You will find ten articles about a variety of subjects, written by Dutch water professionals on the basis of thorough research.

Repeated appeals and a personal approach have resulted in sufficient proposals for articles in order to enable the editorial board to make this selection. The board mainly looked at a clear relation with the daily practice in the water sector. Research, results and findings must be new and produce articles which present new knowledge, insights and techniques with a view to a practical application.

This edition also covers a wide range of topics: from the recycling of industrial residual water to reduce water shortages, to contamination of surface water by wear and tear of car tyres. Furthermore, among other things: probabilities of flood storage basin failure, intrinsically smart drinking water networks, the effect of organic matter content in the soil on flooding and an innovative method to remove nitrogen and methane from wastewater.

Like the journal H2O, Water Matters is an initiative of the Royal Dutch Water Network [Nederlands Waternetwerk (KNW)], the independent knowledge network for and by Dutch water professionals. Members of KNW receive Water Matters twice a year as a supplement with their H2O journal.

The publication of Water Matters is made possible by prominent players in the Dutch water sector. These Founding Partners zijn ARCADIS, Deltares, KWR Watercycle Research Institute, Royal HaskoningDHV, Stichting Toegepast Onderzoek Waterbeheer (STOWA) and Wageningen Environmental Research (Alterra). With the publication of Water Matters, the participating organizations wish to make new, applicable water knowledge accessible.

You can also read Water Matters in digital form at H2O-online (www.H2Owaternetwerk.nl). This publication is also available as a digital magazine in the English language via the same website or via www.H2O-watermatters.com. The English publication is partly made possible by the Netherlands Water Partnership (NWP), the network of approximately 200 collaborating public and private organizations in the area of water.

The articles in English can also be shared from the digital magazine at H2O-online. Furthermore, articles from previous editions can be found on the site.

We hope you enjoy reading this edition. If you have any comments, please let us know via redactie@H2Owaternetwerk.nl.

Monique Bekkenutte Publisher (H2O Foundation)
Huib de Vriend Chairman editorial board of Water Matters

PREFACE

Presenting: Water Matters!

Knowledge journal / Edition 1 / 2019

The failure probability of canal levees from a statistical perspective

Canal levees in IPO class I, II and III comply with the safety standard, provided they are properly maintained. The challenge now no longer lies in testing these levees, but in their management and maintenance.

An extensive network of flood defences protects the Netherlands against flooding. Regional flood defences can be found along regional rivers, canals and lakes. Figure 1 shows an overview of the standardized regional flood defences (approximately 11,500 km) in the Netherlands.

The majority of these flood defences consists of polder drainage canal levees (Dutch: boezemkades) situated along polder drainage canals (Dutch: boezemkanalen) in the North and West of the Netherlands. In the remainder of this article these shall be referred to as canal levees and canals. Canal levees ensure that the water from the canals does not flow into the polders and that excess water can be drained away from these polders. In this article, we are mainly interested in canal levees and we assume that about 8,000 km of the regional flood defences in the Netherlands consists of canal levees.

Figure 1. Map of the Netherlands, the regional flood defences in blue (LOLA Landscape Architects, 2014).

Regional flood defences are periodically assessed against the safety standards. These assessments estimate whether a flood defence is sufficiently resistant to the different failure mechanisms. Flood defences that do not meet the safety standards need to undergo costly reinforcement and millions of euros are spent annually on the strengthening of regional flood defences.

However, it seems like calculated failure probabilities provide an estimate that is often too high. After all, flood defences that have been operating for decades or hundreds of years and have proven their strength, are not sufficiently safe according to the calculations from the safety assessment.

The question is: can we statistically derive the failure probability of a canal levees based on failure events that have occurred in the past? And if this were possible, what would the failure probability be?

Flooding due to failure of the canal levees

First of all, we take a look at the number of flood defence breaches over the past 60 years. This is a long enough period to make statistical statements and short enough to be as homogeneous as possible. In this period, we have found two failure events that led to flooding: the levee breaches at Tuindorp Oostzaan in 1960 and at Wilnis in 2003 (see Figure 2).

Such flood events have major consequences for the environment. After Tuindorp Oostzaan was struck by a flood in January 1960 because a flood defence broke early in the morning, more than 11,000 people had to be evacuated from the area. In the summer of 2003, a flood defence broke in Wilnis after a persistent drought causing the polder behind the levee to be flooded.

Approximately 1,500 residents had to be evacuated, and the total damage was around €16 million. Most of the damage, approximately 90%, was damage to infrastructure, i.e. the sewerage system and the canal levees (Kok, 2006). The total damage during this flood was limited, because a contractor placed a sheet pile in the canal shortly after the breach, to prevent more water to enter the polder.

Figure 2. Upper: flood near Tuindorp Oostzaan 1960 (Historical Archive Tuindorp Oostzaan, no date) and bottom: flood near Wilnis in 2003 (ANP).

In addition to these failure events, critical situations have occurred on several occasions. In 1998, for example, the water level in the canal system of the Delfland Water Board rose so high that it exceeded the levee crest level in some locations, and water flooded over several levees. At the end of July in 2014, this also happened at a canal near Alphen aan den Rijn. These incidents did not lead to a levee breach and the nuisance was relatively limited.

At the Tussenklappenpolder in Groningen, a canal levee was purposely made to breach with the aid of an excavator to avoid possible damage elsewhere. There are also situations where flood defences have failed during (reinforcement) work. These flood defences have not been taken into account in our analysis, as in these cases the strength of the flood defence is apparently (temporarily) affected by human intervention.

Estimation of the annual failure probability

In order to estimate a failure probability based on empirical data, we first need a clear definition of failure. We have chosen a definition that corresponds to the events in Tuindorp Oostzaan and Wilnis. We define a failure event as a breach of a flood defence resulting in a flood with damage to buildings or infrastructure. Other events, such as temporary overflowing of a levee or local instabilities are not considered to be failure events.
To determine the annual failure probability the Poisson-distribution can be used, because the following characteristics are applicable (see McClave, Benson en Sincich, 2014):
1. The experiment consists of counting of a certain number of failure events per spatial unit (i.e., total number of levee sections or total number of canal systems) in 60 years.
2. The average failure probability of a random levee section is constant, assuming that levee strength and hydraulic load do not significantly change in time.
3. The total number of failure events in a levee or in a system is independent of the number of failure events that occurs in other levees or systems, assuming no large changes to the system of canals occur that influence the failure probabilities.

According to the Poisson distribution, the probability of a certain number of failure events is calculated as follows:


In which: λ = the expected number of events within a specified unit of time or space, and x is the number of failure events.

To determine the failure probability two approaches are used, giving a lower limit and an upper limit. The lower limit (lowest probability of failure) is determined by the number of independent canal levees. The upper limit (highest probability of failure) is determined by the number of independent canal systems.

Lower limit (all levee sections are independent)

In the Netherlands there are approximately 8,000 km of levees along canals, divided over approximately 20 canal systems. That is an average of 400 km of levees per system. Under the assumption that ‘independent’ levee sections are 2 km on average, this results in 4,000 levee sections in total, and on average 200 per system.

To determine the lower limit, we use the information that of these 4,000 levee sections, only two have failed in 60 years, λ=2/4,000 per 60 years. Thus, the probability of a random levee section to survive a period of 60 years (x=0) is approximately 0,9995. On average the anual failure probability of a levee section is
This is the failure probability if levee sections are completely independent, or in other words: the lower boundary.

Upper limit (perfect correlation within canal systems)

Levee failure is expected most under extreme loads, such as high canal water levels, possibly in combination with strong winds and large amounts of precipitation. These loads occur, to some extent, on the entire system, which indicates a certain degree of dependency. Also the strength characteristics of levees are to some extent dependent on strength characteristics of surrounding levees, as they often consist of locally available materials and are designed to withstand similar loads.

Therefore, the average failure probability is also determined under the assumption that all levee sections within the same canal system are fully dependent. We do this in a similar way as with independent levee sections, only now with λ=2/20 because over a period of 60 years, there have been two failure events in 20 canal systems. Thus, the probability of a levee system to survive a period of 60 years (x=0) is 0.905. Per year the probability of failure of 1 or more failed systems is:
In a fully dependent series system, the failure probability of the system is equal to the failure probability of the element within the system with the highest failure probability:


In which i is the index of the levee sections in the system. This means that the average failure probability of a levee section per year is not greater than 1/600.

However, within the same system, the load can vary considerably, due to local precipitation causing some levees to be more saturated than others, or because the wind causes wind setup in the canal water levels. This means that the levee sections within the system are not fully dependent. Therefore, the failure probability of levee sections is likely smaller than the calculated upper boundary.

Recommendations for practice

In this article, we estimate the upper and lower limits of the failure probability of canal levees based on previous failure events. Our derivation shows that the average failure probability of canal levees does not exceed 1/600 per year and this can probably be reduced further. However, we are talking about failure probabilities whereas the IPO standards are expressed in exceedance frequencies.

The guidelines state that the failure probability may be 20% of the exceedance frequency (see Table 1). During the past 60 years, canal levees in IPO class I, II and III have demonstrated that they meet this failure probability requirement. In Table 1 these levees are highlighted. Canal levees in IPO class IV and V do not directly meet the failure probability requirement. For these flood defences, we recommend to further reduce the probability of failure based on information of survived loads. This is referred to as “proven strength”. This way, unnecessary reinforcement of flood defences can be prevented.

Table 1. IPO standardization with associated frequencies of exceedance. According to the guidelines, the failure probability can be 20% of the exceedance frequency. Canal levees in the highlighted IPO classes meet the safety standard, according to our approach.

An important condition for our approach is that the failure probability of canal levees remains the same over time. Although the soil structure and soil characteristics of flood defences do not or hardly change over time, various “ageing processes” such as subsidence of the levee or cracking of the top layer can contribute to weakening of a levee. But through good management and maintenance, these ageing processes can be identified and tackled at an early stage. In short, if well maintained, canal levees in IPO class I, II and III meet the safety standard. The challenge no longer lies in assessing these flood defences, but in their management and maintenance.

Stephan Rikkert
(Delft University of Technology)
Matthijs Kok
(Delft University of Technology)

Summary


The Netherlands has an extensive system of regional flood defences of which a large part consists of levees along canals, approximately 8,000 km. In the past 60 years, only two failure events have occurred that actually led to flooding. Based on this information, the average failure probability of canal levees has been determined from a statistical perspective. The estimated failure probability is considerably lower than the allowable failure probability, following from the IPO class I, II and III safety standards. Canal levees in in IPO class I, II and III therefore meet the safety standard, provided they are well maintained.


Acknowledgements


We would like to thank the STOWA, who made this research possible with their financial support.


Sources


Historical Archive Tuindorp Oostzaan, no date Watersnood 1960 [Floods of 1960]. Retrieved from: http://www.historischarchief-toz.nl/350-2/

Kok, M. (2006). Schade na een overstroming. Taak van overheid of eigen verantwoordelijkheid? Externe Veiligheid, 4, 15-17.

McClave, J. T., Benson, P. G., Sincich, T., & Sincich, T. (2014). Statistics for business and economics. Essex: Pearson.

LOLA Landscape Architects (2014). Dijken van Nederland.

^ Back to start

STORAGE BASIN

Failure from statistical perspective

Knowledge journal / Edition 1 / 2019

Wear and tear of car tyres: what ends up in the water/environment?

All drivers know their tyres will wear out and that they will need to be replaced over time. But what happens to the worn rubber on the road? Do these worn particles end up in our environment and if so, how much of it does? Deltares conducted the first study on this issue.

Research into this issue is necessary as estimates from literature show that this involves large quantities. Wagner et al. (2018), for example, estimate that this amounts to more than 1 million tonnes per year for the whole of Europe. It is expected that a large part of these particles is washed off the road when it rains and ends up in our water system. This raises questions about the possible consequences:
• the potential consequences of tyre particulates for humans and the environment are still largely unknown. Further research into the risks is urgently needed;
• if there are harmful effects, what countermeasures can be taken? Think of dredging, to remove the matter from the water system. However, this could also lead to mobilization of the rubber particles in the water increasing the bioavailability of the rubber and the substances contained therein. An alternative could be to collect the water that flows off the roads reducing the runoff. There are also other solutions conceivable.

Estimates of the amount of tyre particulates in our environment are uncertain: direct measurements are scarce. The alternative is to estimate the amount of material released on the basis of population figures and road use and to track its transport and fate using a mathematical model. The data used in such methods are often inaccurate and a certain expansion is inevitable - just think of the variations in driving behaviour or types of car tyres. In addition, under the influence of sunlight, the rubber particles undergo all sorts of processes such as clumping together (aggregation) and degradation. This changes the shape and size of the particles and their spread through the environment.

Deltares, together with the American company Cardno Chemrisk, has carried out a study on behalf of the European Tyre & Rubber Manufacturers' Association. The research focused on the following questions:
• How can the total emissions of tyre wear be estimated and what is the volume of their emission?
• How can we set up a transport model for this type of pollution based on what is known about what happens to rubber particles in the environment?
• Given the inaccuracy of a lot of the data involved, what parameters determine the accuracy of such estimates?
• How do the results relate to the scarce measurements available?
The study concerned two river basins, the Scheldt and the Seine, both located in densely populated regions in Europe.

Estimation of emissions

Direct measurements of the amount of tyre dust are scarce. We must therefore make do with estimates based on car use data. Fortunately, various databases are available for this purpose:
• the COPERT database for distances travelled - regionally, for different types of vehicles;
• EUROGLOBALMAP with the lengths of the roads in Europe and a distinction of the different types of roads. After all, driving on a motorway is different from driving on a country road;
• the Landscan database with population figures;
• the CORINE Land Cover database for land use.

Finally, a report by Deltares and TNO (2016) provided information about the emission of car tyre particulates per type of vehicle. With all these sources, it was possible to estimate the emissions. These estimates are expressed in tonnes of tyre and road particles because in the environment, they are found clumped together. About half of a particle consists of car tyre material. This yielded the following most likely values:
• Scheldt: 12,600 tonnes of tyre and road particles per year;
• Seine: 27,600 tonnes of tyre and road particles per year.
According to the Deltares and TNO report, the emission-determining variable, i.e. car use can be easily charted (with a 10 per cent margin) but the uncertainty lies in the emission factors (margin of 50 per cent for different categories of substances).

Dispersion of tyre dust

These emissions were then tracked based on insights into processes such as soil erosion and run-off during rain showers and disposal in sewage treatment plants using a transport model in the aquatic environment followed by export to the sea (see Figure 1).

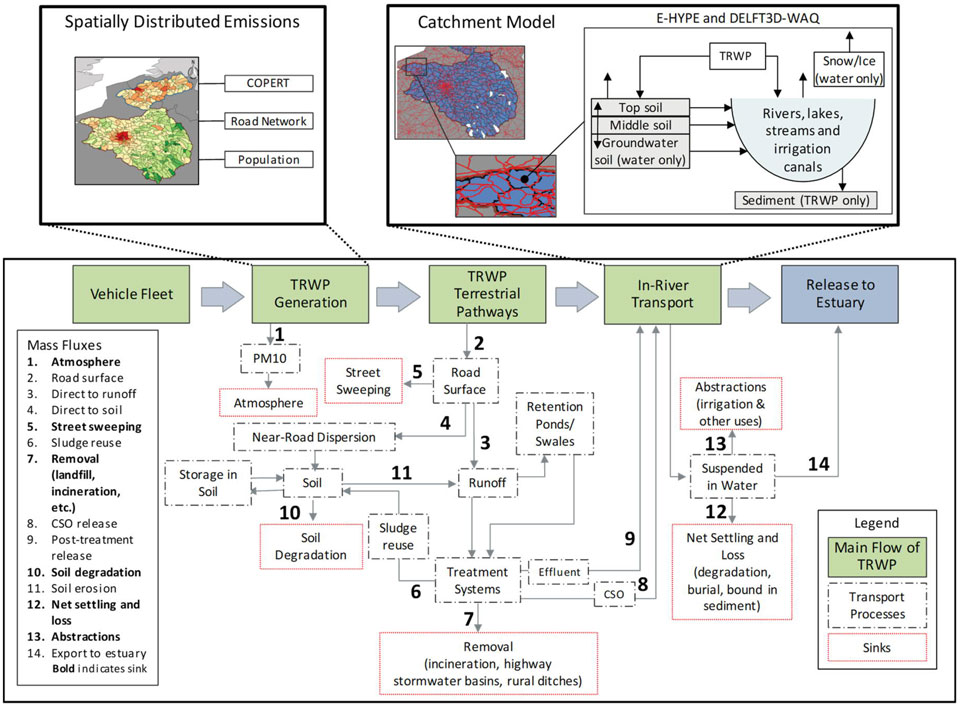
Figure 1. Conceptual model that describes the emission and transport on land of dust particles from the wear of tyres and road surface to the estuary (Unice et al., 2018A).

The transport model includes a number of elements:
• tyre and road particles vary in size, shape and density. For this reason, a range of particle sizes and other properties has been included in the model calculations;
• aggregation (clumping) of car tyre and road particles or to (natural) suspended matter;
• sedimentation of the different types of particles;
• the effect of biofouling - when particles are in the water for a longer period of time, a layer of organic matter surrounds the particles, which influences the size and density;
• degradation under the influence of light (UV).

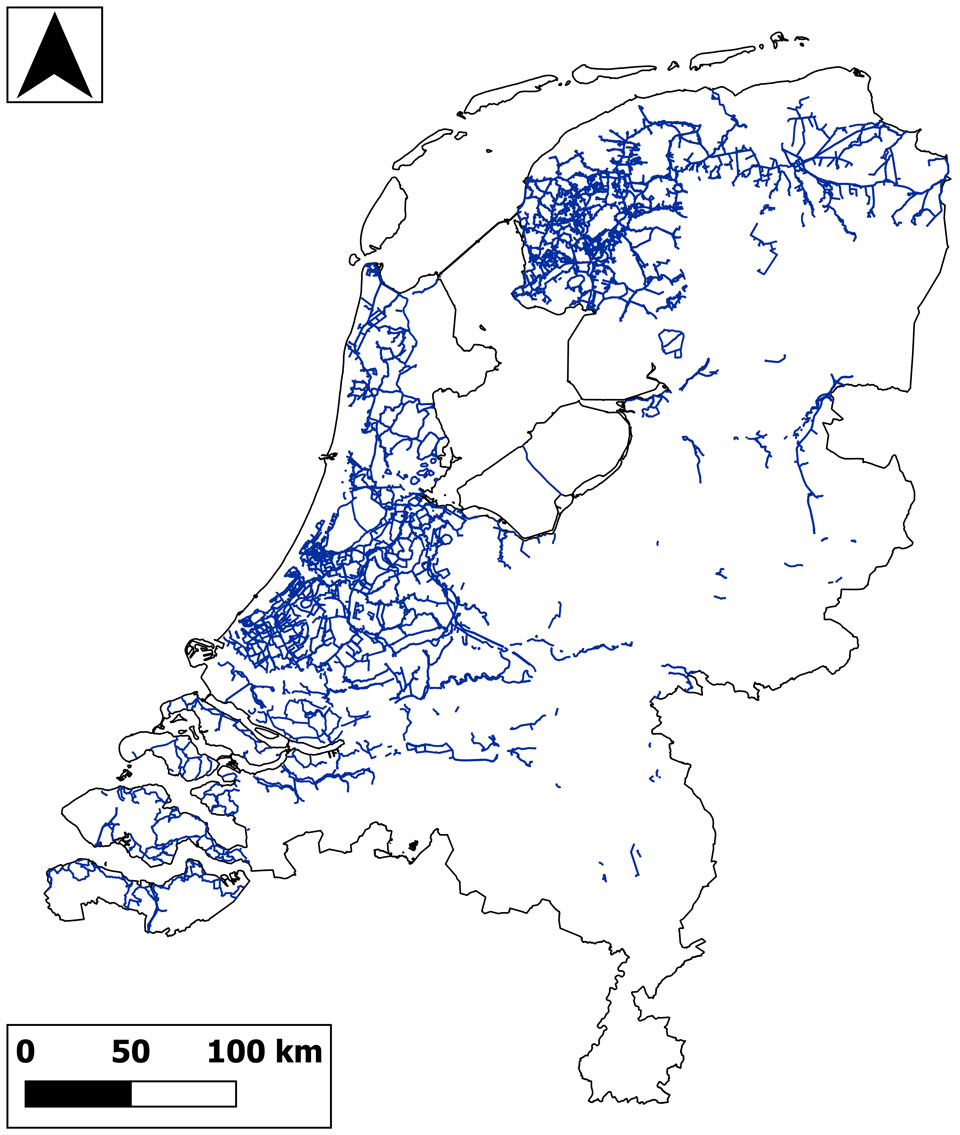
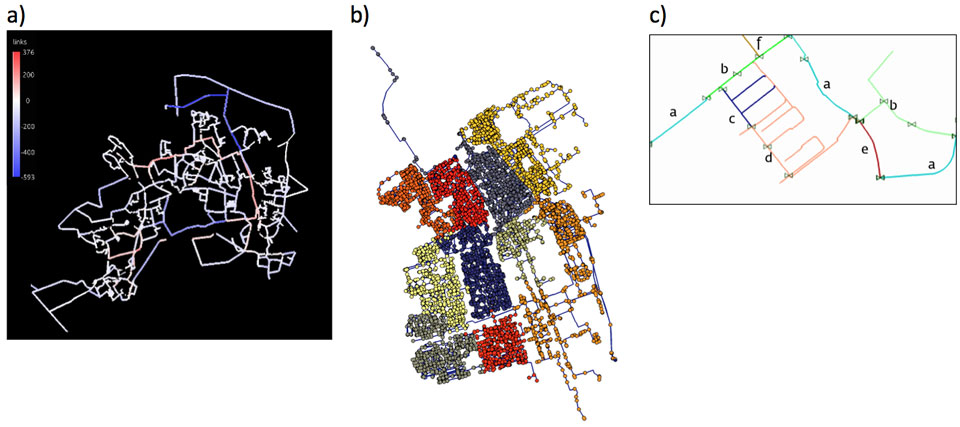
The model calculations demonstrate the following (see figure 2 for the geographical distribution):
• in the Seine basin, approximately 18 per cent of the tyre particulates ends up in surface water. A large part of it sinks and ends up in the sediment. A small part (2 per cent of the total) is carried along in the water and eventually ends up in the estuary and possibly in the sea;
• the rest of the released material finds its way into the atmosphere (2 per cent), is removed by sewage purification (18 per cent) or ends up in the soil (62 per cent);
• the largest contribution comes from urban areas;
• the results for the Scheldt basin are comparable to those for the Seine basin.

Models always contain uncertainties. Therefore, in this study much attention has been paid to the processes that are specific to this pollution. The most important parameters that cause the dispersion in the final result are the variation in particle size and the density of the rubber. Therefore in the case of the 2 per cent that ends up in the estuary, spread is expressed as a 50% reliable interval (1.4 to 4.9%).
The research focused on the transport and fate of car tyre dust. Follow-up research could focus on the harmfulness of this matter to the environment also in relation to other substances in the rubber such as zinc. The content of this substance in car tyres can rise to almost 2 per cent.

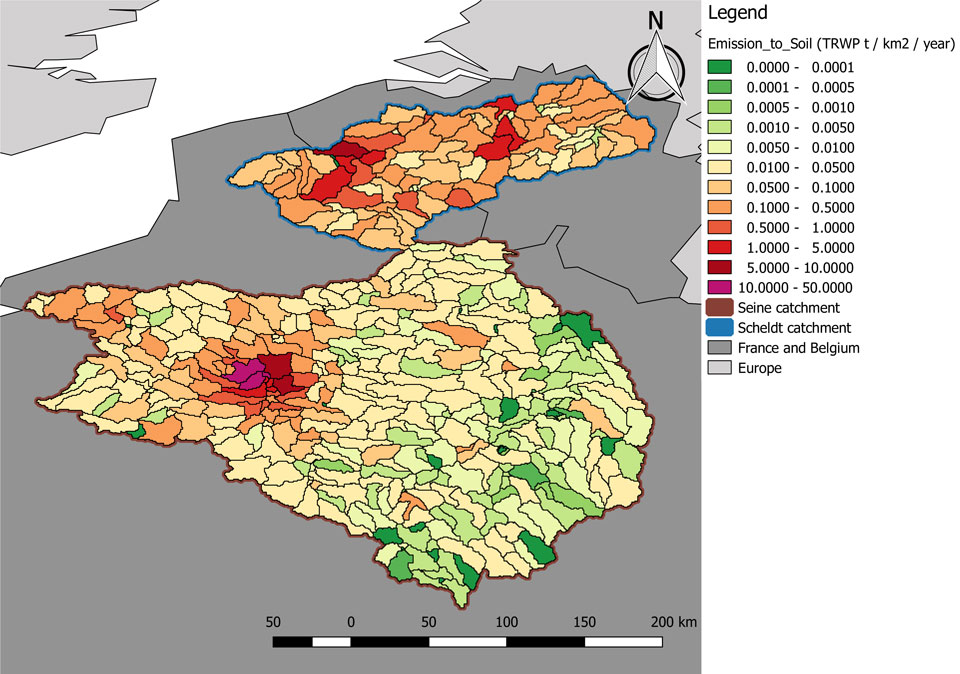
Figure 2. Emissions to surface water in the catchment areas of the Scheldt and Seine rivers.

Implications for water management

In practice, for water management this means that a lot of tyre dust accumulates in the seabed. Unfortunately, it is difficult to say what the environmental impact will be. However, laboratory research has shown that all kinds of substances may be released even if the rubber particles themselves do not cause any damage.
The conclusion that much of the tyre dust remains in the water bed means on the one hand that the water phase is less directly polluted but on the other hand that the rubber particles remain in the environment for a longer time. When dredged, this material can be released and to a certain extent with consequences for soil life.

A first step

This research was a first step in mapping the problem with regard to the aquatic environment. The industry now has better insight in the dispersion of tyre dust and uses the results in product development. The possible environmental effects play a role but also safety (tyre grip on the road) and lifespan. The study was also presented to the EU’s Environment DG, where it provided additional insights for the formulation of future policy. In addition to the impact on humans and the environment, the most important unknown is the long-term behaviour of the tyre dust in soil and sediments. Further research is in preparation and will have to make clear to what extent something can and should be done about it. By far the best solution is of course to prevent this type of contamination as much as possible. In this light, technical developments concerning environmentally friendly car tyres are most welcome.

Arjen Markus
(Deltares)
Marc Weeber
(Deltares)
Jos van Gils
(Deltares)
Dick Vethaak
(Deltares)

Summary


Car tyres wear out and end up in the environment together with road particles. Little is known about what happens to these particles afterwards. A Deltares model study for the catchment areas of the Seine and the Scheldt made it clear that there are many uncertainties but that rubber particles mainly end up in the soil (62%) and on the water bed (18%). The environmental effects are not known but it is clear that rubber particles on the water bed can release certain substances. Further research is needed, especially into long-term behaviour in (water) soils and sediments.


Literature


Deltares and TNO, 2016. Bandeslijtage wegverkeer. Emissieschattingen Diffuse bronnen – Emissieregistratie. Commissioned by Rijkswaterstaat - WVL. Available from: http://www.emissieregistratie.nl/erpubliek/documenten/Water/FactSheets/Nederlands/Bandenslijtage%20wegverkeer.pdf.

Kole, P.J., Löhr, A., Van Belleghem, F.G.A.J., Ragas A., 2017, Wear and Tear of Tyres: A Stealthy Source of Microplastics in the Environment, International Journal of Environmental Research and Public Health

Manufacturing industry, 2017, Michelin helps achieve sustainable driving with environmentally friendly car tyres, Online: https://www.maakindustrie.nl/nieuws/michelin-brengt-duurzaam-autorijden-dichterbij-met-milieuvriendelijke-autoband (accessed on 1 January 2019)

Unice, K.M., Weeber, M.P., Abramson, M.M., Reid, R.C.D., van Gils, J.A.G., Markus, A.A., Vethaak, A.D., Panko, J.M., 2018A. Characterizing export of land-based microplastics to the estuary – Part I: Application of integrated geospatial microplastic transport models to assess tire and road wear particles in the Seine watershed. Science of the Total Environment, volume 646, pp. 1639-1649.

Unice, K.M., Weeber, M.P., Abramson, M.M., Reid, R.C.D., van Gils, J.A.G., Markus, A.A., Vethaak, A.D., Panko, J.M., 2018B. Characterizing export of land-based microplastics to the estuary – Part II: Sensitivity analysis of an integrated geospatial microplastic transport modeling assessment of tire and road wear particles. Science of the Total Environment, volume 646, pp. 1650-1659.

Wagner, S., Hüffer, T. Klöckner, P., Wehrhahn, M., Hofmann, T., Reemtsma, T., 2018. Tire wear particles in the aquatic environment – A review on generation, analysis, occurrence, fate and effects. Water Research, volume 139, pp. 83-100.

^ Back to start

CAR TIRE WEAR

What ends up in water?

Knowledge journal / Edition 1 / 2019

How to detect as many leaks as possible with as few flow meters as possible

It is becoming increasingly important for water companies to have an accurate overview of the water flows through the water distribution grid and to be able to quickly identify disruptions in the water supply. Dunea and KWR are working together on one of the possible strategies for achieving this: by dividing the water supply grid into District Metered Areas.

District Metered Areas (DMAs) are subsections of a water supply grid of which all inlet and outlet pipes are fitted with a volume flow meter. This enables the water balance of these areas to be measured. The water balance provides insight into water flows and consumption patterns and reveals deviations from regular consumption.
With the latter, DMAs also offer the possibility of detecting and locating (latent) leaks in real time, even before a small leak can develop into a pipe burst. In countries with bigger altitude differences and greater water losses, DMAs have been playing a crucial role in pressure control and leakage reduction for years.
Installing flow meters and adjusting the water supply grid configuration is a challenging task. In urban areas such as The Hague, room to manoeuvre in the underground is typically scarce. Moreover, many vital functions are present above ground, making it difficult to obtain permits to carry out the work. In addition, modifying the transport grid poses challenges due to the importance and depth of the pipes.
In the end, it takes at least a week to install one flow meter. For this reason, it is essential to install as many DMAs as possible with as few volume flow meters as possible. This is a complex task, as the Dutch water supply grids generally are highly looped, allowing for countless different DMA configurations.
Within the joint research of the dune water companies, KWR has added functionality to the Gondwana software tool to support the design of DMAs with evolutionary optimization methods. Here we answer the question of how Dunea, supported by this tool, can divide its most complex grid, The Hague, into optimal DMAs.

Optimization

In close cooperation with a team of experts from Dunea's distribution department, items were described such as: the annual budget available to Dunea for installing water meters, a representative model of the water supply grid and an overview of the pipes that were eligible to serve as a DMA boundary. By digitizing such expert knowledge, the optimization tool can be provided with input that describes practice as accurately as possible. This is crucial to obtain realistic results that are valuable for the water company.
Gondwana uses an evolutionary algorithm, an optimization algorithm inspired by concepts from genetics. The general principle behind this type of algorithm is shown schematically by the blue boxes in figure 1. First, a collection of possible solutions is created (a population of individuals). The solutions are tested for their performance according to the user criteria. The least successful solutions are discarded (natural selection) and the collection is supplemented with new solutions. The new solutions are generated by creating small variations in well-performing solutions (mutation) or by combining elements from two well-performing solutions (reproduction). The process is then repeated several times, gradually improving the quality of solutions (evolution).

Figure 1. Schematic representation of the evolutionary optimization algorithm used. The blue boxes summarize the general operation of the algorithm. The white boxes illustrate the specific implementation of the algorithm used to optimize a DMA configuration.

The white boxes in figure 1 show the way in which the algorithm was specifically applied to optimize a DMA configuration. A single configuration is defined as a water supply grid in which each node is assigned to a specific DMA. During reproduction, mutations in the offspring are made by: exchanging nodes between DMAs, merging adjacent DMAs, splitting single DMAs and constructing a new configuration with DMAs from two different “parents”. The performance of a potential DMA configuration is determined on the basis of two aspects. Firstly, the number of boundaries between DMAs should be as low as possible so that it takes as little effort as possible to achieve the configuration. Secondly, the total water consumption within a DMA should be as low as possible so that any deviation from regular water consumption is as obvious as possible.

An optimal DMA blueprint

The two performance targets are opposites: more volume flow meters are required in order to make smaller, more accurate DMAs. Therefore, the first result of optimization is a collection of possible DMA configurations with differing, optimal combinations of the number of boundaries and the maximum consumption (see figure 1, “Results for The Hague”). This provides insight in Dunea’s leeway to balance sensitivity against costs in their DMA configuration for The Hague. Based on this, a choice was made for the configuration shown in figure 2.

Figure 2. The selected DMA configuration for The Hague. The different coloured boxes represent different DMAs. The three numbered lines represent the first three of eight steps that comprise the optimal transition to this configuration. The magnified part of the water supply grid shows several boundaries between DMAs, marked with a star.

The DMA configuration in figure 2 creates 15 DMAs with 92 boundaries. These are too many boundaries to realize in a short time. Therefore, an optimal transition was determined, a sequence in which The Hague can be evenly divided into increasingly smaller DMAs through the yearly realization of a limited number of the remaining boundaries. In figure 2, the first three steps of this transition are shown by the numbered lines. Five more similar steps are to follow before the 15 DMAs are completed.

Completion

With the resulting DMA configuration, Dunea will set to work in drawing up a concrete implementation plan. Given the looped nature of the water supply grid, it would be inefficient to maintain all existing DMA boundaries as pipelines equipped with a volume flow meter. The final plan will therefore include the creation of a security of supply analysis to be made for the entire region of The Hague. The analysis examines the importance of each DMA boundary (marked as stars in the magnified supply grid in figure 2) for the water supply, with the following options:
- indispensable boundaries will be fitted with a flow meter (most large supply pipelines will remain in operation, as, ultrasonic sensors will be used and placed on the outside of the pipeline whenever possible);
- boundaries required in the event of an emergency are closed using an existing valve;
- boundaries that have become superfluous will be permanently removed, a guiding principle being to avoid the creation of dead end pipes with little or no consumption.
This analysis determines what work will need to be done and enables an estimation of the necessary costs to be made. This forms the basis of a planning for the coming years. At the beginning of 2019, a start was made with the first “cut”, dividing the region of The Hague into two balance areas according to line 1 in figure 2. These areas will then be further subdivided, until the configuration in figure 2 is achieved.

Outlook

The results of the optimization provide Dunea with a concrete and substantiated starting point for a DMA configuration. For Gondwana, this is an important proof-of-principle that shows the added value of implementing numerical optimization techniques within the design process of a water company.
We would like to emphasize the importance of interaction between the expert and the optimizations. On the one hand, the results of an optimization depend on the question and knowledge entered by the expert. On the other hand, the results provide the expert with an understanding of the various possible optimal solutions, which creates a new perspective on the problem so that the question and input can be further detailed. Based on the understanding acquired in this project, the security of supply analysis mentioned above will be included in the performance criteria of future optimizations.
By dividing the water supply grid into DMAs, Dunea will gain more insight into what is happening in the water supply grid. Dunea expects to use the final DMA configuration in order to:
• monitor and control water flows through the grid;
• validate the consumption models used in business operations with the actual consumption measured in DMAs;
• measure and then reduce the water losses per DMA in The Hague.
Active leak detection and leak localization will also be used with DMAs. Small leaks can be detected and repaired before they develop into a burst pipe. On the one hand, this will reduce public inconvenience (as a pipe burst can cause considerable damage). On the other hand, leakages are detected more quickly so that customers are inconvenienced less by supply interruptions. It will also be possible to detect and trace latent leaks that are not visible at ground level, reducing water losses.
Dunea also expects there to be long-term advantages in its approach of not equipping all boundaries with volume flow meters but to also close pipes where possible. This constitutes a redesign of the water supply grid to better meet the requirements for water quality and security of supply:
• the amount of sections in the water supply grid with long retention times of potable water is reduced;
• the larger pipes better fulfil their role as transmission lines;
• chances of sediment settling are reduced, which ultimately leads to fewer brown water complaints.
In this way, the transport grid in The Hague is more effectively used to provide potable water to the hinterland of the supply area, while the main distribution grid is better used for its intended purpose to provide potable water at the district level.
All in all, the results of this project provide a first outline of the water supply grid of the future, designed and monitored using modern techniques. The opportunities offered by the Internet of Things with respect to sensors fit this concept well. Ultimately, this will make high quality potable water coming from the tap become a matter of course even more!

Karel van Laarhoven
(KWR Watercycle Research Institute)
Dennis Gardien
(Dunea Duin & Water)

Summary


DMAs enable water companies to better monitor the water flows through the water supply grid and to identify and detect leakages more quickly. However, achieving a complete DMA configuration requires a large number of costly interventions in the drinking water distribution network. Dunea and KWR are working together to use evolutionary algorithms to optimize a configuration to require as few interventions as possible. The result is a target configuration that Dunea will gradually be completing in the coming years.

^ Back to start
DISTRICT METERED AREAS

Detect leaks

Knowledge journal / Edition 1 / 2019

Towards intrinsically smart drinking water networks

The concept of smart drinking water networks has gained ground over the past ten years. This not only involves the installation of smart sensors and algorithms, but also a smart design of the drinking water and measurement networks.

Smart networks are drinking water networks equipped with sensors, which allow a water company to better control the network in terms of quantity (flow, pressure), the condition of the pipes (strain gauges), or for example remotely controlled valves. The term may also refer to the use of algorithms to identify failures (such as pipe breaks) or for advanced process control.
All this can be considered as adding a nervous system to the body of the infrastructure. It enables water companies to make 'smarter' use of the networks, but it does not really make the networks themselves smarter. In this article we present the concept of 'intrinsically smart networks': a design based on smart design philosophies and a smart use of materials.

Smart design philosophies


Self-cleaning networks
The drinking water network is subdivided into functional groups: the primary part (transmission network), the secondary part (distribution up to neighborhood level) and the tertiary network (distribution to customers). Since the early 2000s, the tertiary network in the Netherlands has been constructed in such a way that the risk of water discoloration is minimal and no cleaning is required. Discoloration is generated when particles accumulated in the pipeline network are resuspended at a suddenly higher flow velocity. Discolored water is harmless but leads to dissatisfied customers. Such an accumulation of particles can be prevented by generating a high flow velocity once a day. This requires a tertiary network with pipes of non-corrosive material and with a small diameter; moreover, one-way flow is required and no dead ends may occur in the last tens of meters. Such a branched network design, to be realized with a tool like DiVerDi, is about 20 percent shorter and therefore cheaper.

Climate-proof networks
The drinking water temperature is largely determined by the temperature of the soil surrounding the pipes of the secondary and tertiary network. Due to climate change and increasing urbanization, the temperature of the tap water will more often exceed 25 °C, with negative consequences for the biological quality of the drinking water (figure 1). This can be prevented with a climate-proof design: keep pipes away from district heating pipes and electricity cables, install 20 centimeters deeper, and/or put pipes, wherever possible, on the shady side of the street or under grass (cooling because the grass evaporates soil moisture).

Figure 1: Drinking water heating from source to tap: influence of weather and urbanisation, including anthropogenic heat sources in the subsurface. From Agudelo-Vera (2018).

Numerical techniques for smart network design


Pipe diameters
Drinking water networks are normally designed with hydraulic modelling software. However, the number of possible designs is so large that it is practically impossible to examine even a small number of the possible well-functioning configurations. Numerical optimization techniques, as implemented in Gondwana, generate designs that meet all requirements and perform optimally on user-defined criteria. A water utility wants to install a pipeline network as cheaply as possible and at the same time meet the requirements for pressure and, for example, water quality on all connections (see figure 2a). Since networks have to last for decades, it is important to think about the future water demand.

Figure 2. Examples of numerical optimization of different aspects of drinking water networks. a) optimization of pipe sizing - colors indicate changes in diameter compared to the current situation (from Vertommen et al 2018); b) optimal subdivision of a network into DMAs for anomaly detection (from van Laarhoven et al 2017); c) optimal order of replacement of the pipes (from Vertommen et al 2018).

Conversion of an existing network
Once a desired network layout is generated, the question arises as to what the best path is to realize this layout. The key question is: what is the best order to replace pipes? Objectives such as minimizing inconvenience to the customer or a faster improvement in system performance can be leading. This is another optimization problem that can be addressed with a tool like Gondwana (see Figure 2c for an example).

Valve placement
In the design of the secondary network, well considered valve placement is essential. Valves are necessary to isolate parts of the network during work to minimize the number of customers affected. Currently, a network is usually designed without valves, which are added to the plan afterwards. This is not ideal. Valves sometimes do not work properly or are even impossible to find, which means that sometimes more customers are affected than necessary. An optimal location choice of the valves (with a minimum number of valves per isolation section and without dependent sections) is necessary to guarantee maximum reliability. Tools such as CAVLAR help assess a design at this point.

Philosophies and numerical techniques for smart 'nervous systems'


Network design with smart meters and sensors
The main advantage of smart water meters for customers is that they provide detailed knowledge about where and when the water demand is high or low. By installing pressure or water quality sensors and processing their data in a model, the knowledge can increase further.
Water quality sensors (generic or specific) are becoming increasingly available. However, water distribution systems are so complex that even hydraulic experts have difficulty identifying optimal locations for water quality sensors. Nonetheless, good sensor networks can be designed using numerical optimization techniques, included in software tools such as TEVA-SPOT and Contamination Source Toolkit.
The interpretation of the large volumes of measurement data requires a good understanding of the system. A smart design of the pipe network including sensor network can greatly improve the interpretability of these 'big data'.

DMA design
DMAs or district metered areas are parts of the distribution network that are isolated from the rest by flow meters and/or closed boundary valves. This makes it possible to calculate a water balance for such a DMA, which contributes to the most common purpose of DMAs: leak detection. The design of DMAs may be trivial for simple network structures, but for open and meshed networks the subdivision into DMAs may be less obvious. Here too, numerical optimization techniques can be applied. The objective is to determine the locations for flow meters in such a way that the required number of meters is minimal at a desired detection limit for e.g. leakages. Figure 2b shows an example (for more details see the article by Van Laarhoven and Gardien elsewhere in this edition of Water Matters).

From dumb to smart networks

With these philosophies and tools, the design and construction of a real, intrinsically smart network is within reach. This applies in the first place to new infrastructure, to be built without the burden of history. But also existing infrastructure can be made intrinsically smarter. This requires the following steps:
1. defining objectives and boundary conditions;
2. collecting accurate and up-to-date information about the existing pipe network and its use;
3. determining possible future scenarios for the spatial and demographic development of the area and water consumption;
4. optimizing the design of the network and/or configuration of DMAs / valves / sensors;
5. optimizing the transition to this optimal design;
6. realizing the design of step 4 using the transition of step 5;
7. developing decision models for autonomous functioning.
For the first two points, many water companies have already made a considerable effort, although additional steps remain necessary to successfully implement points 4 and 5 in particular. The third point remains a challenge. The last three steps have been developed in a research context, and have not yet been applied in practice.

Ultimately, we expect that the intrinsically smart grids approach will lead to a better performing water supply system with more control and knowledge for less money.

Peter van Thienen
(KWR Watercycle Research Institute)
Mirjam Blokker
(KWR Watercycle Research Institute)

Summary


The concept of 'smart drinking water networks' has gained ground over the past ten years. It is mainly sensors and algorithms that make a network smart in their use. By also taking a smart approach to the design of pipe and sensor networks, drinking water networks become 'intrinsically smart'. The move towards such 'intrinsically smart networks' should lead to a better water supply network with more control and knowledge for less money.


References


Agudelo-Vera, C.M. (2018) Aanpak om de hotspots in het leidingnet terug te dringen. BTO rapport 2018.024

Berry J., et al. (2010). User’s Manual TEVA-SPOT Toolkit Version 2.4. EPA 600/R-08/041B.

Blokker, M. (2009). Handleiding DiVerDi, ontwerpgereedschap voor vertakte netten. KWR Rapport 9, also: https://www.watershare.eu/tool/self-cleaning-network/

Blokker, M. et al (2011). Asset management of valves. Water asset management international, 7(4), 12-15

Blokker, M. and E. J. Pieterse‐Quirijns (2013). Modeling temperature in the drinking water distribution system. Journal‐American Water Works Association 105.1 (2013): E19-E28

Van Laarhoven, K. et al (2017). Optimal design of virtual DMA's with gondwana." LESAM 2017, Trondheim

Van Laarhoven, K. and D. Gardien (2019). Water Matters (this issue)

Van Thienen, P. (2014). Alternative strategies for optimal water quality sensor placement in drinking water distribution networks. Hydroinformatica International Conference, New York.

Van Thienen, P. and I. Vertommen (2015) Gondwana: a generic optimization tool for drinking water distribution systems design and operation, Procedia engineering 119

Van Thienen, P. et al. (2017). Advanced modelling and optimization in drinking water distribution systems, Water Solutions.

Vertommen, I. et al. (2018). Optimal design of and transition towards water distribution network blueprints. EWAS International

Vreeburg, J. H. G. (2007). Discolouration in drinking water systems: a particular approach. Ph.D. thesis

^ Back to start

DRINKING WATER

Towards smart networks

Knowledge journal / Edition 1 / 2019

Mitigating agricultural water shortages by recycling industrial residual water

Treated residual water from the Bavaria brewery was used for the subirrigation of a plot of agricultural land. The water table rose and the water available to the crop increased. The use of industrial residual water can mitigate water shortages.

We are increasingly confronted with drought damage in agriculture and nature as well as an increasing pressure on the availability of water for high-grade applications such as the production of drinking water. Strategies are being developed to control these risks and to secure long-term supplies of freshwater. This includes increasing regional self-sufficiency in meeting the demand for freshwater and improving the utilization of the available water sources. This requires an approach in which various sectors jointly search for solutions for their water needs and the water needs of others.
A number of industrial sectors discharge their treated residual water to surface water despite water shortages in agriculture. Using this residual water in the area rather than discharging it unused can contribute to the mitigation of water shortages.
Bavaria wishes to cooperate with farmers and water managers in the use of its treated residual water (effluent from the wastewater treatment plant) to meet agriculture’s water requirements and reduce the risk of water shortages. The agricultural sector’s reuse of Bavaria’s residual water is one of the objectives of the “Boer Bier Water” initiative (www.boerbierwater.nl) and F2Agri (www.f2agri.eu).
Within the context of “Boer Bier Water”, and in cooperation with TKI-Watertechnology, the reuse of Bavaria’s residual water by neighbouring farms has been brought into practice. This included a field trial in which some of the residual water was infiltrated into agricultural soil using a controlled drainage system (figure 1).

Figure 1: Treated residual water from the Bavaria wastewater treatment plant (green) is discharged via three routes: an Archimedean screw discharges the water directly to the plot of agricultural land (red) and to the Wilhelmina canal (dark blue). The canal transports treated water to fields at a greater distance from the plant. The (conventional) discharge to the Goorloop (light blue) is minimized. The black dashed line indicates the transect from the plot to the Goorloop in figure 2; the black dots are soil drilling locations in the transect.

Subirrigation

Controlled drainage systems have been developed both to discharge and to retain water (e.g. Stuyt, 2013). A further advantage is that they provide opportunities for the active control of the groundwater level and the soil moisture conditions in a plot of land (Bartholomeus et al., 2015).
The feasibility of this active optimization of soil moisture contents depends on the availability of water. Additional options for the optimization of the water supply for the crop arise when water is actively fed and infiltrated via controlled drainage. This is referred to as “subirrigation” the objective of which is to raise the water table and increase the soil moisture content.

Field trial

A subirrigation system was laid out in a plot of agricultural land (8.5 hectares) in the vicinity of the Bavaria brewery, supplied with residual water from the brewery’s wastewater treatment plant (figure 1) (Bartholomeus et al., 2018). The plot was an area of grassland at a relatively high elevation and with summer water table levels at more than two metres below the surface (figure 2). With these initial dry conditions, it was questionable whether subirrigation would improve the water supply to the crop.
The local soil profile is of great importance to subirrigation. It ideally consists of a highly permeable top layer around the drainage/infiltration pipes and resistant lower layers that retard downward seepage of the subirrigation water.
A network of sensors laid out to monitor the effects of subirrigation collected information about the local effects and the radiating effects on the surrounding land. Precipitation depth, feed flow rates, groundwater levels, soil moisture contents and groundwater compositions were measured for the analysis.

Figure 2: Cross section of the Goorloop to the centre of the plot (see figure 1 for the transect) including the overall locations of the soil profiles in this transect (dotted = sand, obliquely hatched = loam) and a diagram of the average highest and lowest water table levels (MHG and MLG respectively) without subirrigation.

Results

The objective of subirrigation is to raise the groundwater level so that more water is available for the crop. This should increase crop transpiration and consequently increase the crop yield. Although the effect of subirrigation on crop transpiration was not measured directly, an insight into the relationship was obtained by carrying out simulations with the SWAP (Soil-Water-Atmosphere-Plant, swap.alterra.nl) hydrological model.

Figure 3: Precipitation depth (grey line), measured groundwater level (large dotted line) and simulated groundwater level without subirrigation (red line). The simulations are applicable to the situation without additional sprinkling. The grey areas indicate the subirrigation periods (from May 2016 onwards). It is clear that the groundwater level is considerably higher with subirrigation than without subirrigation.

Figure 3 shows the groundwater level measured at the centre of the plot during the year prior to subirrigation (2015) and during three seasons with subirrigation (2016-2018). The measurements were used to calibrate the SWAP model for the plot. The calibrated model was then applied to compare the groundwater level and the effects of too dry or too wet conditions on crop transpiration in periods with and without subirrigation.
Without subirrigation, the groundwater level declines throughout the summer (figure 3), resulting in inadequate soil moisture contents for the crop if no sprinkling irrigation is applied. The effect of the extreme rainfall in June/July 2016 is evident from the peak in the groundwater level. Subirrigation used in 2016, 2017 and 2018 halted the natural decline in the groundwater level and substantially increased the levels in the three years.
Subirrigation raised the groundwater level by 100–150 cm compared with the reference without subirrigation. This shallow groundwater level alleviated the water shortages that would have otherwise resulted even in the very dry first half of the 2017 summer. The groundwater level was also raised substantially in 2018 although this was insufficient to meet the crop’s high transpiration requirements during this extremely dry period. This meant that the farmer had to use additional sprinkling.
Groundwater level measurements revealed that subirrigation at this field trial scale did not have any waterlogging effects on adjacent plots and did not impact deeper aquifer layers. The groundwater recharge realized on the plot is small in comparison with the groundwater recharge from larger-scale precipitation. Consequently, subirrigation has a large local effect but is rapidly attenuated outside the area.
Although the groundwater level is raised substantially, the infiltration resistance of the subirrigation system increases during long water supply periods and the water supply capacity decreases. This increase in the infiltration resistance may be due to the clogging of drainage pipes. The infiltration resistance can be reduced to its original value by interrupting the water supply, draining the system and then reconnecting the water supply.
Although the infiltration resistance increased during 2017 (Bartholomeus et al., 2018), the system had recovered by the time that subirrigation was applied in May 2018 (see increase in groundwater level with subirrigation in figure 3). Alternating periods of infiltration and drainage could offer a suitable means of controlling clogging of the system.

Discussion

An insight needs to be gained into the opportunities and risks associated with the reuse of effluent (“recycled water”) for the supply of freshwater. The use of treated industrial residual water to combat drought, which is still rare in the Netherlands is an emerging form of (climate) adaptation in anticipation of the increasing water shortages confronting the Dutch agricultural sector.
Bavaria’s initiative to return residual water to its surroundings is a good example of these developments. Bavaria demonstrates that an industrial stakeholder can make a contribution to the self-sufficiency of a region and can cooperate in the realization of a more climate-robust water system. Achieving this requires cooperation between all stakeholders. This is provided for in the “Boer Bier Water” process. Nevertheless, little is currently known about this theme.
High sodium concentrations in the effluent need attention in view of the possibility of accumulation in the soil and salt damage to crops. The infiltration of the effluent also periodically results in high phosphate concentrations in shallow groundwater. As this is probably due to the mobilization of phosphate in the soil, the accumulation of phosphate will not be a bottleneck.
Some streams on the Pleistocene uplands of the Netherlands are partially or fully dependent on effluent to maintain base flows during the summer months. Using effluent for water supplies in agriculture should not result in streams drying up, and harm the ecology of the streams. More knowledge about this issue needs to be developed, and the interests of agriculture and nature will need to be considered in conjunction.
This project offers a good example of a solution provided by local cooperation in which a stakeholder with surplus water makes an active contribution to the water supplies for neighbouring farms. Utilizing these available alternative water flows for water supplies to agriculture can reduce the demand for shallow and deep groundwater for sprinkling purposes, which spares the groundwater for more high-grade applications.
However, current groundwater policy would not appear to be tuned to new solutions of this nature. An insight is needed into the extent to which this approach contributes to buffering and groundwater availability and into its acceptability in relation to water quality. A carefully-considered policy stance can then be adopted at both regional and national level within the Delta Programme to prepare the Netherlands for more robust freshwater supplies.

Ruud Bartholomeus
(KWR & Wageningen University & Research)
Marjolein van Huijgevoort
(KWR)
Jouke Rozema
(Aequator Groen & Ruimte bv)
Arnaut van Loon
(KWR)

Summary


Industrial residual water can be used to combat drought in agriculture rather than simply being discharged to surface water. Bavaria has implemented the reuse of its treated residual water by farms in its surroundings. A pilot study has been carried out using Bavaria’s residual water from its wastewater treatment plant for the subirrigation of a plot of agricultural land.

The results revealed that subirrigation raised the groundwater level and consequently increased the soil moisture content to a level that improved the water supply to the crop. Using industrial residual water to combat drought rather than discharging it unused can contribute to the alleviation of water shortages.


References


Bartholomeus, R.P., Van den Eertwegh, G.A.P.H., Simons, G.W.H., 2015. Naar online en optimale sturing van Klimaat Adaptieve Drainage. Stromingen, 24(4): 27-41.

Bartholomeus, R.P., Van Loon, A.H., Van Huijgevoort, M.H.J., 2018. Hergebruik van industrieel restwater voor de watervoorziening van de landbouw - Praktijkproef subirrigatie met gezuiverd restwater van Bavaria. KWR 2018.089, KWR, Nieuwegein.

Stuyt, L.C.P.M., 2013. Regelbare drainage als schakel in toekomstig waterbeheer, Alterra, Alterra Report 2370, 488 pages, 269 fig.; 40 tab., Wageningen.

^ Back to start

WATER SHORTAGE

Reuse industrial residual water

Knowledge journal / Edition 1 / 2019

Methods for determining groundwater levels: can we do better?

During the extreme summer of 2018, we became used to news reports about groundwater levels. But how are groundwater levels actually measured and how are these measurements processed into groundwater maps? This article lists all established methods including possible sources of error. It is clear from the results that an independent validation for a monitoring network for groundwater measurements is not an unnecessary luxury.

In the Netherlands, a groundwater characteristic (GWC) for an area is determined in three steps: (1) in-situ monitoring of the groundwater level (in the field); (2) interpolation and extrapolation over time; and (3) spatial interpolation and aggregation. This procedure is not standardized. In practice, several definitions and different combinations of methods are used. We have analysed the methods and techniques used over the past 25 years. The aim was to determine the impact of the errors that can occur at each step, and the consequences of this for the resulting groundwater characteristic.

What are the definitions that are used?

To define “groundwater level” several definitions are used. As a result, it is not clear whether the phreatic groundwater level, a perched water table, a rise in height or the (geohydrological) groundwater level has been measured. In addition, it is customary in the Netherlands to characterize the groundwater situation at a measuring location with averages, the so-called GxGs. These GxGs are not uniformly determined either.

Figure 1. Diagram of groundwater level measurements with a groundwater observation well (fully perforated) and a deep piezometer (short perforated filter)

How are the measurements carried out?

Four methods are used to measure the groundwater level: (i) groundwater observation wells; (ii) piezometers; (iii) open bore holes; (iv) field estimates (Figure 1). These methods are standardized (type of pipe, locations, measuring methods and data storage), however, they do leave room for their own interpretation (location, depth, filter length, frequency, relationship with soil type, etc.). For example, if a groundwater level standpipe is drilled through a poorly permeable layer on which a so-called perched water table has formed, you will not know exactly what you are measuring. This necessitates interpretation of the measurement, which can lead to subjectivity.
A piezometer measures the head and not the phreatic groundwater level. Piezometers provide a more accurate measurement than groundwater standpipes. This also applies to open bores provided that drilling takes place up to a poorly permeable layer on which there is a difference in head or a perched water table and, if necessary, several bores are drilled at different depths to determine the occurrence of perched water tables. A comparison of the four measurement methods using 13 assessment criteria showed that the groundwater level standpipe and the piezometer performed best (Table 1).

Table 2. Assessment of the four methods used to measure the watertable depth (++ stands for "complies with criterion" and – for "does not comply at all")

Errors in measuring the groundwater level are not found so much in the measurement itself, but in the uncertainty about what is being measured: the phreatic groundwater level in stationary or non-stationary state, the depth up to a perched water table or the head? Additionally, errors are introduced when over time the standpipes are moved, lengthened or when the filter length is adjusted. Uncertainty also lies in the fact that it is not known whether the water level in the standpipe is in balance with the water in the soil (just think of influences such as groundwater flow, air pressure and temperature). In addition, accuracy is often low when pressure sensors are used. Each of these causes can lead to errors ranging from a few centimetres to tens of centimetres.

How is upscaling over time done?

Upscaling groundwater level measurements over time can be done using (i) a direct calculation from time-series; (ii) statistical models; (iii) process models and (iv) expert knowledge. Upscaling in time is easy when the time series are sufficiently long and sufficient measurements have been carried out. A time series that is too short can be extended using statistical models and/or process models.
Statistical models are based on a model in which the groundwater level at a given time is a function of the groundwater level at the previous time plus other relevant information, for example the precipitation surplus in the intervening time. Process models have the advantage that the most relevant physical laws are explicitly part of the model. The disadvantages are that model making and calibration are more laborious and more input data are required. A point of attention is that calibration can cause GxG flattening when only the “fit” is considered and not the “noise” (including more extreme values).
Temporal upscaling can also be done on the basis of expert knowledge: with profile and field characteristics, a field expert can estimate a GxG. In practice, multiple aggregation methods are often combined, for example expert knowledge in combination with process models or a process model with a statistical model.
A measurement series sometimes contains data from several standpipes, because a standpipe has been moved or extended, sometimes supplemented with model calculated water levels (e.g. with a time series model). In temporal aggregation, the errors are partly averaged but new sources of errors can also be introduced. As a result, the error in the GxG of a standpipe location can reach a few decimeters and in some cases even more than one metre. Often the errors are greater at locations with short time series.

How is spatial interpolation and aggregation carried out?

Upscaling an area or a region to a groundwater characteristic is done using four methods: (i) expert knowledge; (ii) methods based on random sampling theory; (iii) geostatistical models; (iv) physical-mechanistic models.
Experts can estimate the average groundwater characteristic (GWC) for an area on the basis of their knowledge of the area. In doing so, they will not only use established GWCs at measuring locations within the area (and outside of the area if these locations are near the target area) but also additional information such as the height map, the soil map and water levels of surface water.
Random samples are only used for spatial aggregation. This involves choosing random locations for determining the GWC and then based on the sample, estimating the frequency distribution of GWCs or the parameters such as the average for the area in which the sample was taken.
Geostatistical models do not require sampling but there are requirements for the minimum number of measurement locations. Another difference is that the results only apply under certain model assumptions (e.g. linear relationships, constant variance of regression residues, stationarity of the semi-variogram).
Physical-mechanistic models have the advantage that all kinds of (often non-linear) physical relations can be included. With process models, it is possible to extrapolate to other situations (in space and time) and to calculate measures and/or scenarios. A disadvantage is that often a lot of the required input data and process parameters are not known and are based on assumptions.
Often temporal and spatial aggregation methods are combined. Quantification of model errors often proves difficult and is therefore often disregarded. With spatial interpolation, the interpolation error comes on top of errors in measurement and temporal aggregation, which means that the error can ultimately average about 20 to 50 centimetres depending of course on the area and the method used. On the other hand, spatial aggregation averages random errors in the point estimates of GWCs.

What have we learned?

Over the past sixty years, the methods for measuring and interpreting groundwater levels have changed in order to obtain groundwater characteristics (GWCs) for an area. Four different methods can be used for each of the three steps in this process. The combination that is used is usually based on the purpose of the research and the available data. The use of different combinations of methods and techniques has certainly led to a better understanding of the GWCs in the areas studied.
The impact on the final result of measurement errors and inaccuracies in temporal and/or spatial interpolation and aggregation has never been systematically investigated. Our analysis shows that changes in methods for measuring and interpreting groundwater levels lead to significant systematic differences in the GWCs. However, we were unable to assess the accuracy of the GWCs established partly because of the remedial interactions between the errors.
Determining groundwater characteristics is an iterative process in which each step must be repeated several times to check that the assumptions required to complete a particular step do not impede the next steps. An analysis should be made at the beginning of each study based on the research questions in order to select the most suitable measurement sites (datasets) and then the most suitable methods to arrive at a GWC. It is essential to assess whether the resulting accuracy is sufficient to answer the research questions.

Validation network

Our research shows that, although we have a national monitoring network for measuring groundwater levels, we do not know for sure whether drought stress or flooding in the Netherlands is under or overestimated. To objectively and process-independently determine the groundwater level, independent validation data are required at randomly selected locations. Unfortunately, existing monitoring wells rarely meet this criterion. The introduction of a validation monitoring network to objectively determine the reliability of models and maps used independently from existing monitoring networks would solve this problem.

Henk Ritzema
(Wageningen University)
Martin Knotters
(Wageningen Environmental Research)

Summary


In the Netherlands, groundwater levels are important for nature and agriculture and especially for foundations. However, different methods are used to measure groundwater levels and to obtain a regional and national picture. We have analysed how commonly used combinations of methods influence the resulting groundwater characteristic (GWC). We show that there has been no systematic assessment of the reliability of used measuring methods and models. As a result, it is uncertain whether drought stress or flooding in the Netherlands is underestimated or overestimated. We recommend a more systematic approach to reduce the impact of errors and we favour the introduction of a validation measurement network independent of existing networks.


Literature


Ritzema, H.P. et al (2018). Analysis of the methodologies used to derive groundwater characteristics for a specific area. Geoderma Regional, Published on line, doi: 10.1016/j.geodrs.2018.e00182

Ritzema, H.P. et al (2012). Meten en interpreteren van grondwaterstanden. Analyse van methodieken en nauwkeurigheid. Wageningen, Alterra report 2345. 122 pages.

This article is a summary of Wageningen Environmental Research's project “Verdroging” [“Desiccation”]. The project was initiated following discussions in recent years on “numerical desiccation” and was financed by WEnR and the Ministry of Economic Affairs’ Knowledge Base project “Duurzame ontwikkeling van de groenblauwe ruimte” [“Sustainable development of the green-blue space”].

^ Back to start

GROUNDWATER LEVELS

Methods of determining

Knowledge journal / Edition 1 / 2019

Organic matter: is it worthwhile for water management?

Are investments in soil organic matter worthwhile for water management? It shows that in poor sandy soils, organic matter has a favourable effect on water availability, however, in other soils the effect is limited.

Soil organic matter is in the spotlight as an opportunity to buffer the effects of climate change on the water system. With this in mind, a case is made of increasing soil organic matter contents by adding additional organic material. However, it is questionable what such investments mean for moisture supply in dry periods and for surface run-off in wet periods.
Many policy themes are centred around the theme Soil. Soil plays a crucial role in the development of sustainable agricultural systems, in circular farming and in the carbon sequestration challenge. Water management expects soil to buffer the impacts of more extreme weather conditions due to climate change.
Soil organic matter plays a major part in all these themes. In this article, we discuss whether, based on research data, investments in soil organic matter are worthwhile for water management. Does organic matter contribute to the prevention or abatement of yield reduction by drought and does it contribute to flood reduction?
The idea is that organic matter levels in agricultural soils have decreased, however, trend analysis using many soil samples shows that the level is stable or shows a slight upward trend1. In a few situations, there has been a decline.

Functions of organic matter in soil

1 Organic matter increases water storage. Usually the available soil moisture is expressed as the difference between water content at field capacity (“sufficient water available”) and at wilting point (“plant can no longer extract water”). From available measurements, relations are derived2 that allow prediction of the effect of organic matter on the available soil moisture. This relationship is elaborated in figure 1 for two sandy soils.

Figure 1 Extra soil moisture available in a layer of 10 cm by increasing the organic matter content by 1% as a function of the organic matter content before the increase.

It is clear that an increase in poor soils with a low organic matter content has the greatest effect. The lines in the figure are for a soil layer thickness of 10 cm. An increase in the organic matter percentage by 1% in a root zone of 30 - 50 cm deep results in 2 - 3 mm extra available water. The effect is greater for poor sandy soils: 5 - 8 mm extra water available. Of the arable acreage on sandy soil, 4% (ca 13,000 ha) has an organic matter content lower than 2% and 22% of the area (ca 75,000 ha) has a content between 2 and 3%.

2 Organic matter lowers the bulk density of soils, which can lead to more favourable conditions for deeper rooting allowing a crop to reach deeper water.

3 Organic matter affects the stability of soil aggregates. Soil layers with an organic matter content greater than 5% have 80% or more stable and larger aggregates (cohesive soil particles) compared with soil layers with a low organic content matter content3. A good soil structure is essential for the trafficability, the infiltration capacity, the prevention of surface sealing and for a reduced risk of soil compaction.

4 Organic matter, in addition to its clay content and acidity, contributes to the ability of soils to bind the cations calcium, magnesium, potassium and ammonium thus keeping them partially available for plant uptake.

5 Organic matter plays an important role in soil life. It is the only source of energy and nutrients for heterotrophic organisms. These organisms are at the basis of the soil-food web and in turn serve as the main food source for other soil organisms thus contributing to a) digestion of organic matter and mineralization and supply of nutrients for plants; b) the favourable soil-physical functions described above and c) the resilience of the soil-plant system to withstand diseases.

Statistical analyses of soil data bases indicates that there is hardly any relation between organic matter content and infiltration capacity of the soil4. However, farm system research with different forms of long-term organic matter management in conventional and organic agriculture shows that the infiltration capacity of the soil is increased by an increased supply5. However, soil management itself has a greater influence on infiltration capacity than organic matter contents measured in soil samples.

Effective organic matter and accumulation time

The part of the supplied organic matter (manure, compost and crop residues) that has not been degraded or converted by soil organisms after one year is defined as effective organic matter (EOM) as it contributes to the accumulation of OM in soil. Supplied organic matter with a higher EOM content contributes more strongly to increasing soil organic matter content than materials with lower EOM content.
Increasing the organic matter content is a long-term process. An increase of the organic matter content by 1% by the supply of a material with a high EOM content (compost) requires 10 to 30 years.

Importance for agriculture

A farmer can increase the organic matter content by consciously choosing crops that produce a lot of dry matter and of which the crop residues (stems, stubbles, leaves, roots and chaff) are added to the soil. Grassland brings relatively much organic matter into the soil, however, the destruction of the sod for grassland renewal, diminishes a considerable part of the accumulated stock. Grassland management aimed at minimizing sod destruction contributes to the accumulation of organic matter in the soil.
The prevention of bare soil and year-round cultivation of crops (ground cover crops, buffer crops) increase the input of organic matter and reduce soil erosion and nutrient leaching.
The effect of organic matter on agricultural production is almost always indirect. A meta-analysis of results of 20 long-term experiments in different European countries indicates that the additional effect of the supply of organic matter is on average not significant6.

Importance for water management; prevention and yield reduction and flooding

In a dry summer when the precipitation deficit is constantly increasing, the effect of additional water storage is limited. However, in a moderately dry summer with regular rainfall, the additional water storage can be used several times and a sprinkling session can be postponed and sometimes saved.
Almost no quantitative information is available on the effects of organic matter on the reduction of discharge peaks as a result of improved soil structure and also not on the effects that earthworms and other organisms have on water infiltration. This is investigated in the Lumbricus research programme.
Organic matter-oriented soil management (choice of crop, introduction of crop residues, cultivation of cover crops and nitrogen catch crops) can result in a greater infiltration capacity and a rougher ground surface reducing discharge peaks. In an exploratory model study, effects of this type of soil management on surface runoff have been calculated7. It was assumed that soil management leads to greater permeability and that the crops develop a deeper root system. In addition, a scenario was calculated in which the relief of the ground surface was adjusted (levelling, thresholds, field edge dam). Figure 2 shows the results for arable land on a so called “veldpodzol” soil for situations with repetition times of 2 and 10 years. Especially the summer peak discharges after heavy rain showers are reduced.

Figure 2 Calculated reduction of extreme 4-hour discharges in the summer and 24-hour discharges in the winter at repetition times of 2 and 10 years due to improved infiltration properties of the soil and an adjustment of the ground surface relief.

Ground surface adjustments have a greater effect than improved infiltration through soil management. In addition, ground surface adjustments have a much shorter response time as compared to organic matter-based soil management. However, frequent water ponding on the ground surface is undesirable for many crops. A less extreme form of ground surface adjustment such as for example, making micro-dams or creating tiny holes can lead to improved water infiltration and reduction of discharge peaks and can even have a positive effect on crop production by reducing ponds.

Conclusions
• Effects of measures to increase organic matter content on drought resistance and peak discharges are difficult to express in millimeters or euros per hectare. Direct effects are only rarely quantified in field research. Because of this knowledge gap, model studies on the effects have an exploratory character.
• The effect of organic matter on the prevention and of yield reduction by drought is mainly relevant for soils with a low percentage (<2 to 3% organic matter). The acreage of these type of soils is small.
• Surface runoff decreases as a result of cultivation measures and of soil management measures aimed at increasing organic matter. However, effects can only be expected at the longer term and they are uncertain. Adjustments to the ground surface relief have a much faster effect.

Piet Groenendijk
(Wageningen Environmental Research)
Henk Wösten
(Wageningen Environmental Research)
Romke Postma
(Nutriënten Management Instituut)
Rob Ruijtenberg
(Stichting Toegepast Onderzoek Waterbeheer)

Summary


Water managers have expectations that an increase in soil organic matter levels contributes to buffering the effects of more extreme weather conditions due to climate change. In poor sandy soils, organic matter has a favourable effect on water availability but in other soils the effect is limited. Organic matter-oriented soil management can improve soil structure with beneficial effects on the reduction of surface runoff and flooding. This article only looks at physical effects as quantitative knowledge about the influence of soil biology is not yet available.


Sources


1. Velthof et al (2017) Effecten van het mestbeleid op landbouw en milieu; Beantwoording van de ex-postvragen in het kader van de evaluatie van de Meststoffenwet. Wageningen Environmental Research, Rapport 2782

2. Wösten et al (2001) Waterretentie- en doorlatendheidskarakteristieken van boven- en ondergronden in Nederland: de Staringreeks. Revised edition 2001. Alterra Report 153.

3. Faber et al (2011) Droogteresistentie van grasland in de Gelderse Vallei. Kijk eens wat vaker onder de graszode. Alterra Report 2373.

4. Rahmati et al (2018) Development and analysis of the Soil Water Infiltration Global database. Earth Syst. Sci. Data, 10:1237-1263.

5. Williams et al (2017) Organic Farming and Soil Physical Properties: An Assessment after 40 Years. Agron. J. 109:600–609

6. Hijbeek et al (2017) Do organic inputs matter – a meta-analysis of additional yield effects for arable crops in Europe. Plant Soil 411:293-303.

7. Schipper et al (2015) Goede grond voor een duurzaam watersysteem Verdere verkenningen in de relatie tussen agrarisch bodembeheer, bodemkwaliteit en waterhuishouding. STOWA Report 2015-19.

^ Back to start

ORGANIC MATTER

Worthwhile for water management?

Knowledge journal / Edition 1 / 2019

Surface runoff: exploratory study of a hydrological phenomenon that has received little attention

Surface runoff is a rather unknown phenomenon in the Netherlands, even though it can result in extremely large discharges that can cause erosion and flooding. Surface runoff has cut deeply into Northeast Twente streams. Surface runoff can also cause peak concentrations of nutrients and plant protection products in surface water. Moreover, water discharged in surface runoff is in fact a loss to the supply of freshwater to crops. The above resulted in Vechtstromen Water Authority’s decision to initiate a study.

Surface runoff is of relevance to both water authorities who need to monitor the quality of surface water and water table levels and to farmers who need to make economical and efficient use of manure and organic material. Last summer made clear that “saving” water is equally important as preventing flooding. Surface runoff always needs to be minimized: it is an undesirable loss item in the total water balance. Surface runoff is, in other words, a hydra-headed monster.
The importance of more knowledge about surface runoff should be evident to everyone involved in water and water management, from farmer and water manager to planner: how can we develop good predictive models and weigh measures in a drainage area against each other if we do not have a full understanding of this phenomenon?
Climate change is also a contributing factor. It causes an increase in the total annual precipitation and causing longer dry periods during the cultivation season that alternate with increasingly extreme precipitation events. This increases the risk of surface runoff.
This all gives water managers more than enough reason to study the problem and search for perspectives for action. The first objective of the studies discussed in this article was to gain an impression of the volume of surface runoff and of the precise circumstances in which the phenomenon occurs (measurements at plot scale). The next step was to develop a model to indicate area-wide surface runoff. This was based on a series of measurements at plot scale to indicate the need and necessity followed by a regional estimate of surface runoff based on area characteristics.

2014: measurements at plot scale

In 2014, Deltares carried out a field study in the Vechtstromen Water Authority’s region that examined a sloping plot on the flank of the Ootmarsum push moraine ridge in Northeast Twente. This addressed the question as to what “surface runoff” precisely is in practice: where does it occur, to what extent and intensity and does it relate to groundwater seepage or excess precipitation?
This research lay within the scope of the “DROP” (benefit of governance in DROught adaPtation) Interreg project. The field study began in the spring of 2014 and measurements were carried out for a period of two years. The reason why so little is known about surface runoff rapidly became clear: obtaining an objective and quantitative insight into the phenomenon is a time-consuming process. The study requires a comprehensive measurement network with phreatic groundwater measurement points, soil moisture sensors and gutters to collect surface runoff (see photo). Special runoff stations also needed to be laid out to measure surface, drain and ditch runoff and precipitation. Furthermore, it was necessary to map the soil in detail (depth of clay loam), measure the soil infiltration capacity and carry out analyses of the chemical composition of groundwater and surface water.
The most important conclusion that there is a considerable difference between summer and winter surface runoff. In the summer, the occurrence of surface runoff is determined by the intensity and duration of rain showers and in the winter by the water storage capacity of the soil above the (apparent) water table. Summer showers are much more intense than winter showers. Heavy summer showers (more than 10 mm/h) rapidly overwhelm the infiltration capacity of the soil (3-10 mm/h) and the excess rainwater runs off the surface. The summer water table level is deep below the surface (1 metre or lower) and does not play a role in the generation of surface runoff.
Surface runoff is more frequent in the winter and the measured volumes are larger. Surface runoff usually occurs after lengthy precipitation with high daily totals. This fills the soil with water, when the water table often rises to or near the surface and virtually prevents rainwater infiltration. Frozen soil can also play a role. Surface runoff occurred frequently during the measurement period, on 93 of the 475 days (about 20 per cent of the time)! It should be noted that this was a special situation in which the clay loam barrier in the substratum played an important role.
The study reveals that surface runoff is an important hydrological process, certainly in sloping and barriered areas. Surface runoff will also occur frequently in highly paved areas (urban areas), areas with shallow impervious layers (clay loam in barrier formations) and areas with compacted soil. Peak discharges caused by surface runoff in rural areas can be reduced by implementing relatively simple technical measures at plot level. This is because surface runoff contributes to peak discharges only once the water actually reaches ditches, which can be prevented by creating micro-relief on plots. Working the soil in another manner is a good option for example, by working parallel to the ridges or by improving the permeability of the soil.
The recommendations from this study were to scale up the findings to regional level and to interpret them for other areas with particular attention to sloping areas.

Regional scaling up of surface runoff

A study of normative discharges in the Vechtstromen Water Authority’s region also revealed that surface runoff is a great unknown. The field study at Ootmarsum gave cause to the development of a model, currently a theoretical model based on all available knowledge for mapping area-wide surface runoff. This method takes account of factors including the typical differences between the summer and winter conditions found in Ootmarsum. A comprehensive technical description is given in the journal Stromingen. In essence, this method determines the volume of water that infiltrates the soil and the volume that “remains” on the surface for a specific normative shower (summer) and a sequence of showers (winter). A different approach is adopted for the summer half-year and the winter half-year: for the summer, the intensity of the normative shower is compared with the soil infiltration capacity and for the winter, the quantity of precipitation is set off against the soil water storage capacity (dependent on the water table level and subsurface discharge). An assessment of the water that remains on the surface is then made to determine how much can actually be retained by the micro-relief and any litter, where relevant. The remaining water, the surplus, constitutes the potential surface runoff.

Figure 1. Surface runoff (in millimetres a day) in the summer for a normative shower (or series of showers) with a repeat interval of 1 year (T1, left) and 10 years (T10, right).

This method has been used to prepare maps for the entire Vechtstromen Water Authority’s region that illustrate the theoretical surface runoff in various hydrological situations (T=1 and T=10, see figure 1) in both the winter and summer half-year (figure 1). The potential effect of climate scenarios of the Royal Netherlands Meteorological Institute (KNMI) were also examined. This revealed that there is an increasing probability of winter surface runoff in two “hot” scenarios, WH and WL. It is more difficult to reach conclusions for the summer as the necessary hourly precipitation quantities were not available in the meteorological series from the Twente station.
One of the most important consequences was that daily summer surface runoff of more than 20 millimetres can occur in the current circumstances in a large number of discharge units, in particular with showers with a repeat interval of 10 years. This is considerably more – about 1.5 times more! – than the normative discharge for wet sandy soils listed in the authorative reference work Cultuurtechnisch Vademecum. This is an important indication that surface runoff is an important source for peak discharges and moreover that the list of normative discharges included in the Cultuurtechnisch Vademecum is in need of amendment. Continuing to unquestioningly use the discharge coefficients listed in this reference work in designs and assessments of water courses and structures results in a risk of seriously underestimating the volume of discharges in practice.

Conclusions and further work

Surface runoff is a significant factor in the reaction to precipitation in sloping and barriered areas with low permeability soil (whether compacted by human action or otherwise). Measurements in barriered areas reveal that winter surface runoff can occur during as much as 20 per cent of the time. The theoretical area-wide approach indicates that daily summer surface runoffs of more than 20 millimetres can occur during substantial showers (repeat interval of 10 years) - more than would be expected when using the customary standards. Moreover, the various KNMI climate scenarios indicate a further increase in the probability of substantial surface runoff.
We intend to carry out additional field studies in the coming years for a further examination of the validity of the theoretical results for the Vechtstromen Water Authority’s region. A number of these field studies will be carried out under the auspices of current programmes and projects such as the Lumbricus programme (www.programmalubricus.nl) and the Mineral Valley Twente programme (https://mineralvalley.nl/). We hope that this approach will enable us to assess the merits of the method that has been developed and make any necessary improvements.

Bas Worm
(Waterschap Vechtstromen)
Perry de Louw
(Deltares)
Jan van Bakel
(De Bakelse Stroom)
Harry Massop
(WUR/WEnR)

Summary


Little is known about surface runoff in the Netherlands. In 2014 and 2015, an initial measurement study was carried out on a number of plots near Ootmarsum to obtain a better understanding of this phenomenon. The results were taken into account in a theoretical follow-up study of normative discharges in the Vechtstromen Water Authority’s region. This resulted in a set of maps that indicate the (theoretical) area-wide surface runoff. The intention is to carry out additional field studies to test the value of these maps and the methods used to prepare them.


Literature


De Louw, P. & M. Kuijper (2016). Veldonderzoek oppervlakkige afstroming en regelbare drainage in het kader van DROP. Deltares Report 1208453-000, commissioned by the Vechtstromen Water Authority.

Massop, H., J. van Bakel & P. de Louw (2017) Maatgevende afvoer en maaiveldafvoer in Waterschap Vechtstromen. WEnR Report 2839, commissioned by the Vechtstromen Water Authority. http://edepot.wur.nl/425042

Van Bakel, J., P. de Louw, H. Massop & B. Worm (2018). Maaiveldafvoer in beeld. In: Stromingen, number 2, volume 24, pp 23-36.

^ Back to start

SURFACE RUNOFF

Exploratory study

Knowledge journal / Edition 1 / 2019

Innovative method to remove nitrogen and methane from wastewater

Combining two biological processes – partial nitritation-anammox (PNA) and denitrification coupled to anaerobic methane oxidation (DAMO) – creates a promising wastewater treatment system to further reduce the energy consumption and carbon footprint, and to increase the nitrogen removal efficiency.

Nitrogen removal from wastewater is an energy-intensive process. At the same time wastewater contains energy. In the past decade, biogas recovery from wastewater has received quite some attention to improve the energy-use efficiency and reduce the climate footprint of wastewater treatment. The effluent of anaerobic biogas-producing processes contains ammonium and dissolved methane. Methane is a strong greenhouse gas and it is important to prevent and restrict its emission as much as possible.
The so-called DAMO-microorganisms (Figure 1) are capable of simultaneously removing dissolved methane, nitrite and nitrate from wastewater. A novel wastewater treatment method that combines the processes of partial nitritation-anammox (PNA) and DAMO can improve the cost efficiency and sustainability of nitrogen removal.
The PNA/DAMO-method is currently under development at laboratory scale (2-10 L reactors). Scaling up from a lab to full scale application is a challenge. Therefore, a first intermediate modelling step was performed to explore the feasibility of PNA/DAMO by developing two business cases. This article highlights the main results and addresses the economic potential of the PNA/DAMO implementation.

Figure 1. On the left side, the biological reactions in the PNA/DAMO-method. Right: picture of biomass composition in one of the lab reactors after 9.5 months under oxygen limited conditions (fluorescence microscope, scale 20 µm). Fluorescence labels; Red=nitrate-DAMO; green=nitrite-DAMO; blue=anammox. Picture reproduced with courtesy of Karin Stultiens, Radboud University.

The advantages of PNA/DAMO

PNA-systems have been successfully applied since 2002. Compared to conventional nitrification-denitrification systems the PNA-process reduces the energy demand by 60%, because only part of the ammonium has to be converted to nitrite. Anaerobic microorganisms produce less biomass, which results in lower sludge production. The PNA-system converts almost all the ammonium to dinitrogen gas, except for 10% of the nitrogen that ends up in nitrate. The PNA/DAMO-method will further increase the removal efficiency.
The nitrate-dependent DAMO-process uses the nitrate for methane removal and produces nitrite. The nitrite can be used in the anammox process to reduce oxygen demand for nitrite production (nitritation), or in the nitrite-dependent DAMO-process for methane removal.
Lab research shows that simultaneous removal of ammonium, nitrite, nitrate and methane occurs in the PNA/DAMO-reactors. A nitrogen removal efficiency of more than 95% has already been achieved under controlled conditions. The relative contribution of the different biological processes varies and depends on the nutrient and gas supply, and the biomass composition.

Elaboration of two business cases

The model with the biological reactions (Figure 1) was used to explore the economic potential of simultaneous ammonium and methane removal for two wastewater treatment plants (WWTPs). The actual water composition and treatment performance of each plant were the basis for the business case analysis. The applicability of PNA/DAMO was analyzed for the treatment of effluent of two biogas-producing systems:
1. Reject water of an anaerobic digester sludge dewatering step at a municipal wastewater treatment plant (M-WWTP).
2. Industrial wastewater after anaerobic removal of organic matter in an upflow anaerobic sludge bed (UASB) reactor (I-WWTP). In the current set-up of the industrial plant, the subsequent step is aerobic phosphate removal, followed by N-removal in a PNA-system.
Currently, methane concentrations in the liquid phase do not need to be measured at WWTPs. Therefore, samples were taken to assess the dissolved methane concentrations at both locations. The sample data show that roughly 95% of the dissolved methane (~20 mg/L) after biogas production is lost during the next treatment step. At the M-WWTP the methane is stripped in the process of sludge dewatering. At the I-WWTP methane can partially be removed via aerobic methane oxidation in the aerated phosphate removal step.
To test the potential efficiency of the PNA/DAMO-process in both business cases, it was assumed that enough methane is available for the removal of nitrate produced in the PNA-process. The technical aspects regarding methane addition or avoiding methane losses have not been taken into account in this study.

Table 1. Approach and assumptions in the business cases.

The performance of the PNA/DAMO-method is assessed using process performance and system parameters (step 1, Table 1) and compared to a PNA-system. In the economic model (step 2 and 3), the difference in the process performance was used to calculate the net annual cost savings (at current prices). Using discounting, future cost savings over a certain period are converted to a net present value. There is a positive business case when the net present value exceeds the initial investment costs. The investment costs of PNA/DAMO were calculated using the required reactor volume of the treatment system.
For calculating the required reactor volumes, a maximum volumetric nitrogen load of two kilogram per cubic meter per day was assumed. Future (price) scenarios have been elaborated to test the robustness of the business case results.

Higher nitrogen removal efficiency with a lower climate footprint

For both business cases the results of step 1 indicate that PNA/DAMO performs better than PNA (Table 2). The nitrogen removal efficiency is 10% higher because of the additional nitrate removal. This makes the PNA/DAMO-method an attractive option for WWTPs that need further removal of NOx. The energy consumption for aeration per kilogram of nitrogen removed is 20 % lower.
Because of the lower oxygen demand of the biological system, the sludge production per kilogram of nitrogen removed is also lower. The potential reduction in greenhouse gas emissions for the two business cases is 145 (in case of partial aerobic methane oxidation) and 330 (100% stripping of methane) tons CO2-equivalents per year. This is the combined direct effect of reduced methane emissions and indirect effect of lower energy consumption. The nitrogen load of the reject water at the M-WWTP is high enough to potentially remove all dissolved methane present after biogas production. At the I-WWTP about a third of the dissolved methane after biogas production is removed.

Table 2. Theoretical process performance of PNA and PNA/DAMO in both business cases.

Economic potential

There is a positive business case for PNA/DAMO at both locations for an investment up to € 2000,- per cubic meter reactor volume (2% discount rate) in a green field situation, in which there is no nitrogen removal step after biogas production. Despite its better process performance, there is no competing business case under the current price scenario when comparing PNA/DAMO to the already existing PNA-systems (retrofitting).
Currently, financial incentives to reduce methane emissions are lacking. Industries have no obligation to report methane emissions and the carbon price in the European emission trading system (EU-ETS) is low. Also, nitrite and nitrate discharges are not taken into account in the discharge levy. In both business cases we tested the effect of higher carbon prices and an inclusion of NOx discharges in the nitrogen discharge levy.
At a carbon price of € 150,- per ton emission, both business cases show a positive return on investments at investment costs up to € 500,- per cubic meter reactor volume (2% discount rate). The effect of including total nitrogen in the discharge levy shows similar results. In case both changes are taken in to account, there is a positive business case for an investment up to € 800,- per cubic meter reactor volume.

Challenges for application

There are several challenges for the application of PNA/DAMO. In part these are the same as for the development of PNA. Limited aeration is needed for the partial nitritation. Anammox and DAMO are anaerobic microorganisms and slow growers. Biomass retention and oxygen regulation are therefore critical factors in the development of a PNA/DAMO-system. Oxygen regulation is also important to prevent overproduction of nitrite and competition with faster-growing aerobic microorganisms.
Denitrification processes in the PNA/DAMO-process do not require organic carbon. Therefore, all organic matter can be efficiently converted to biogas. This will also prevent competition with heterotrophic denitrifiers. The granular sludge technology offers a solution for these challenges and has been applied successfully in PNA-systems. Lab research shows that the PNA/DAMO biomass can also grow as granular sludge.
Another challenge is the poor solubility of methane. An important insight gained from the business cases was the high loss of dissolved methane between the sampling points at both WWTPs. Previous research on methane emissions at a sewage treatment plant shows that roughly 75% of the plant’s carbon footprint originates from the sludge line. A lot can be gained when methane emissions can be limited in the treatment process, e.g. by covering reactors and collecting off-gas.
In both business cases, the use of methane for PNA/DAMO reduced the direct methane emission by a total of 300 tons CO2-equivalants per year. Additionally, PNA/DAMO is an efficient denitrification step. The energy consumption for aeration was reduced by 60 MWh per year (both locations summed up). Aeration has to be carefully applied to prevent methane stripping. The reactor design is an important aspect for further investigations into the application of PNA/DAMO.
The emission of nitrous oxide was not taken into account. The DAMO-process itself cannot produce this gas, however, denitrification with residual organic matter in the system could. Further studies should further investigate the production of this potent greenhouse gas in a realistic wastewater treatment set-up.

Future perspective

A technology that currently is not an interesting option from an investment point of view might in the future be a viable option; not only in economic terms, as a result of higher costs, but also because of changes in environmental policies and regulations. The Dutch water taxes, including the water treatment levy, are under revision. Nitrite and nitrate are currently not taken into account in the discharge levies. However, these compounds will be included in the revised levy formula. This may have consequences for WWTPs.
In addition, there is a growing awareness about the actual contribution of methane to global warming. Methane is not included in the EU-ETS and industries do not have to register their methane emissions. This may change in the near future. A growing number of countries and regions introduce some form of carbon pricing or taxing. It is to be expected that legislation becomes more stringent to meet environmental and climate goals. The carbon prices tested in the business cases may become very realistic in the next ten to fifteen years. In the tested future scenarios there is economic potential for the combined PNA/DAMO-method and can, therefore, be considered as future-proof.

Monique Slegers
(Radboud University-Microbiology)
Francisca Maalcke-Luesken
(Radboud University-Microbiology)
Mike Jetten
(Radboud University-Microbiology)
Tim Hendrickx
(Paques BV)
Carla Frijters
(Paques BV)
Richard Haarhuis
(Waterstromen BV)

Summary


Effluent of anaerobic processes that produce biogas contains ammonium and dissolved methane, a strong greenhouse gas. A novel wastewater treatment method to treat this effluent combines two biological processes: partial nitritation-anammox (PNA) and denitrification coupled to anaerobic methane oxidation (DAMO). This promising PNA/DAMO system further reduces the energy consumption and CO2 emission, while increasing the nitrogen removal efficiency. Different (price) scenarios were tested in two business cases to explore the economic potential of PNA/DAMO. Results indicate there is economic potential when nitrogen discharge standards become more stringent or when carbon prices increase.


Acknowledgements


D.Piron, E.Marsman, H.v.Zuijlen (Regional Water Authority Rivierenland), B.Otten (Waterstromen B.V.), C.Uijterlinde (STOWA), R.Rozendal (Paques BV), M.v.Loosdrecht (TU Delft), J.Knoben, P.Geurtsen (RU-Business Economics), S.Lücker, H. Op den Camp, M.v.Kessel, H.Harhangi (RU-Microbiology). Funded by: ERC PoC-grant 713533/Gravitation grant (NWO 024.002.002).


References


Aalbers, R, Renes, G, Romijn, G (2016) WLO-klimaatscenario’s en de waardering van CO2-uitstoot in MKBA's. Centraal Planbureau, Den Haag.

STOWA (2016) Reductie van methaanemissie in de afvalwater- en slibketen. STOWA 2016-09.

Kartal, B, Kuenen, JG, Van Loosdrecht, MCM (2010) Sewage treatment with anammox. Science 328 (5979), pp.702-703.

Van Kessel, MAHJ, Stultiens, K, Slegers, MFW, Guerrero Cruz, S, Jetten, MSM, Kartal, B, Op den Camp, HJM (2018) Current perspectives on the application of N-damo and anammox in wastewater treatment. Current Opinion in Biotechnology 50, pp.222-227.

^ Back to start

WASTEWATER

Remove nitrogen and methane

Archive


Edition 1/2015


Edition 2/2015


Edition 1/2016


Edition 2/2016


Edition 1/2017


Edition 2/2017


Edition 1/2018

ARCHIVE

Previous editions

Knowledge journal / Edition 1 / 2019

ABOUT WATER MATTERS

The knowledge section Water Matters of H2O is an initiative of


Royal Dutch Waternetwerk
Independent knowledge networking organisation for and by Dutch water professionals.


Water Matters is supported by

Alterra Wageningen University
Research institute that contributes by qualified and independent research to the realisation of a high quality and sustainable green living environment.


ARCADIS
Global natural and built asset design and consultancy firm working to deliver sustainable outcomes through the application of design, consultancy, engineering, project and management services.


Deltares
Independent institute for applied research in the field of water, subsurface and infrastructure. Throughout the world, we work on smart solutions, innovations and applications for people, environment and society.


KWR Watercycle Research Institute
Institute that assists society in optimally organising and using the water cycle by creating knowledge through research; building bridges between science, business and society; promoting societal innovation by applying knowledge.


Royal HaskoningDHV
Independent international engineering and project management consultancy that contributes to a sustainable environment in cooperation with clients and partners.


Foundation for Applied Water Research (STOWA)
Knowledge centre of the regional water managers (mostly the Water Boards) in the Netherlands. Its mission is to develop, collect, distribute and implement applied knowledge, which the water managers need in order to adequately carry out the tasks that their work supports.


Netherlands Water Partnership
United Dutch Water Expertise. A network of 200 Dutch Water Organisations (public and private). One stop shop for water solutions, from watertechnology to coastal engineering, from sensor technology to integrated water solutions for urban deltas.

ABOUT WATER MATTERS