CONTENTS

Knowledge journal / Edition 1 / 2017

PREFACE

Water Matters: new insights based on thorough research

This is the fifth edition of Water Matters, the H2O knowledge magazine. This time with nine interesting articles, introducing you to new applicable knowledge in the water sector. These articles are written by Dutch water professionals, based on thorough research.

The Editorial Board made a selection from the many proposals that were submitted. We concentrated mostly on two criteria: Is the knowledge presented here really new and is there a clear relationship with daily practice? We once again can present a wide range of topics.

Water Matters, just like the monthly magazine H2O, is an initiative of Royal Dutch Waternetwerk Water Network (KNW), the independent knowledge network for and by Dutch water professionals. The publication of Water Matters is made possible by leading participants in the Dutch Water Sector. The Founding Partners are ARCADIS, Deltares, KWR Watercycle Research Institute, Royal HaskoningDHV, the Foundation for Applied Water Management Research (STOWA) and Wageningen Environmental Research (Alterra). With Water Matters, they want to make new, applicable water knowledge accessible.

The Netherlands Water Partnership (NWP), the network of approximately 200 cooperating (public and private) organizations in the field of water, makes the English edition possible. For you as water professionals, it's good to know you can share articles from this digital magazine quite easily with your international contacts. Articles from previous editions of Water Matters are also easy to find. We can also be followed via Twitter: @WaterMatters1. We hope you enjoy this edition.

Monique Bekkenutte Publisher (Koninklijk Nederlands Waternetwerk)
Huib de Vriend Chairman Water Matters Editorial Board

PREFACE

Presenting: Water Matters!

Knowledge journal / Edition 1 / 2017

Effects of agricultural measures on emissions of nitrogen and phosphorus in rural landscapes

The use of detailed soil and fertilisation data from agricultural measuring networks and an integrated nutrients model makes it possible to provide insight into the soil quality and the agricultural emissions of nitrogen and phosphorus into the water system at landscape level.

The fen meadow landscape in the western part of the Netherlands faces major challenges, including achieving the ecological objectives of the EU Water Framework Directive (WFD) water bodies and retarding subsidence. The future prospects for dairy farming thereby are also an issue. Solutions are being sought through agricultural water and nature management, investment measures within the Agricultural Water Management Delta Plan (Deltaplan Agrarisch Waterbeheer) and the implementation of improved internal nutrient cycling.
The current mineral balances are largely evaluated at national scale by making use of the STONE model, where soil types and hydrological conditions are clustered into larger uniform spatial units. Hence Groenendijk et al. (2016), for example, provide the WFD reduction objectives per water district. This means only one figure for the entire management area, consisting of multiple polders.
The Amstel, Gooi en Vecht (AGV) district water board wants greater insight into the spatial variation within polders in order to offer more prospects for action for farmers to improve water quality. To achieve this, effective (agricultural) guidance options are required that can be translated into local farm management measures. Wageningen University & Research and NMI (Nutriënten Management Instituut) has been performed research to obtain a better understanding of the variation within and between polders by linking detailed soil and fertilisation data from the agricultural measuring network to an integrated nutrients and soil model, INITIATOR. This model gives insight into the use of animal fertiliser and artificial fertiliser, the surplus and the leaching and run-off of nitrogen (N) and phosphorus (P) at an annual base.

The INITIATOR model

The INITIATOR model (De Vries at al., 2003; Kros et al., 2011) has been developed in order to provide rapid, robust and integrated insight into the supply and discharge of carbon, nutrients and heavy metals in the soil/water system, changes in soil quality and the gaseous losses into the air. This is done on an explicit spatial basis, whereby the spatial scale ranges from a single plot to the whole of the Netherlands. In practical terms this includes the supply of nutrients through organic and mineral fertilisers, deposition, biological N fixation, seepage and crop remains, and the discharge through leaching to the groundwater and run-off to the surface water.
The N and P excretion is calculated at farm level by making use of animal-specific excretion factors. The gaseous N emissions from housing and storage of are calculated for the various categories of animals and animal types, making use of nationally recognised emission factors. A manure distribution module calculates the transport of animal manure at municipality level. A soil module then calculates the fate of nutrients: accumulation, absorption, gaseous emissions or leaching and run-off to the water system. A spatial differentiation has been applied to the calculations by taking account of differences in soil use, soil type and groundwater level which determine the processes that occur. For the P modelling of P sorption, a combination of a rapid and slow pool with a soil type-dependent parameterisation has been used.
INITIATOR uses spatial data obtained from national GIS datasets, such as livestock numbers per farm and the location from the Farms Geographic Information System (Geografisch Informatiesysteem Agrarische Bedrijven - GIAB: Gies et al., 2015) and the location of the plots (RVO.nl). Use is made of long-term average water fluxes derived from STONE for the hydrology. This unique calculation system shows in an integrated, transparent and coherent way the effects of agricultural measures on the N and P losses to the surface water, groundwater and the atmosphere.

Location-specific soil and fertilisation data

For application in the AGV district, use has been made of plot-specific data from the Eurofins agricultural measuring network instead of generic soil data. The Eurofins agricultural network contains data for 6051 plots within the AGV district from the period 2000 and 2014, including the level of organic material, C/N ratio, the N total content, the P saturation and agricultural P fractions such as ammonium lactate –extractable P (P-AL).

Application in the AGV district

Four different polders were selected to illustrate the possibilities of this combined approach: Aetsveld East and West, Demmerik and De Ronde Hoep. All four are virtually entirely dominated by intensively managed grassland. De Ronde Hoep is the only polder where partly (half) natural grassland occurs in the central part. In line with fertiliser legislation and practice, both soil data and the vegetation determine the fertilizer distribution across the farm. These four polders contain around 100 farms in total.
The effect of the approach has been illustrated for P, which is often the limiting nutrient in relation to the occurrence of eutrophication. The Eurofins data shows a considerable spatial differentiation in the phosphate level. On average, the P level increases in the order De Ronde Hoep, Aetsveld East, Aetsveld West, Demmerik (Figure 1). However, the calculated total P fertilisation was found to be fairly homogeneously distributed, and also differs little between the polders. The exception is the central part of De Ronde Hoep, where the natural management allows less fertiliser. This plot-specific soil and fertilisation data was used as input for the model calculations, and was found to be heavily determinant for the ultimate calculated P load of the surface water (Figure 1).

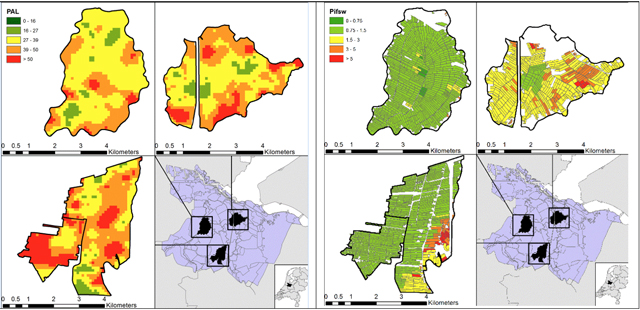
Figure 1 - Spatial variation in measured P-AL (labile P pool in the soil, expressed in mg P2O5/100 g) (Left) and calculated P drainage to surface water (including background drainage) (Right), all expressed in kg P ha-1 jr-1. Clockwise from top left: Ronde Hoep, Aetsveldse polder East and West and Demmerik polder. The final figure depicts the location of the polders in the Netherlands.

The calculated P run-off to the surface water was found to be fairly variable within a polder, particularly in the Aetsveldse polder East and the eastern part of Demmerik polder (Figure 1). The highest P load of the surface water occurs in the Aestveldse polders and in plots on the south-eastern part of the Demmerik polder. The higher P load is strongly related to the background load, which is highest in the Aetseveldse holders. The agriculture-related load is lowest for this polder. On the other hand, the largest proportion of the load of the surface water occurs from Agricultural Activity for the Ronde Hoep and Demmerik polders.
The model calculates lower loads than the loads based on surface water measurements, particularly in De Ronde Hoep. This is partly due to the omission of the P processes in the surface water - the model only calculates the run-off to the surface water - and partly by an (excessively) rough approximation of the background load. Use has been made of results from the STONE model (Groenendijk et al., 2016) for this for the time being, in the absence of adequate supplementary detailed data.

Perspective on agricultural activities

In order to achieve WFD objectives, it is important to identify how the discharge to the surface water can be influenced through agricultural management. To illustrate this, the effect of a number of widely used measures - such as adjustments to the grazing regime, fertiliser-free zones and low phosphorus diet - have been examined. This makes clear in which polder agricultural measures around fertilisation and soil management are useful for improving water quality (Figure 2). Expert knowledge and literature data (e.g. Noij et al. 2012) were used to parameterise the measures.

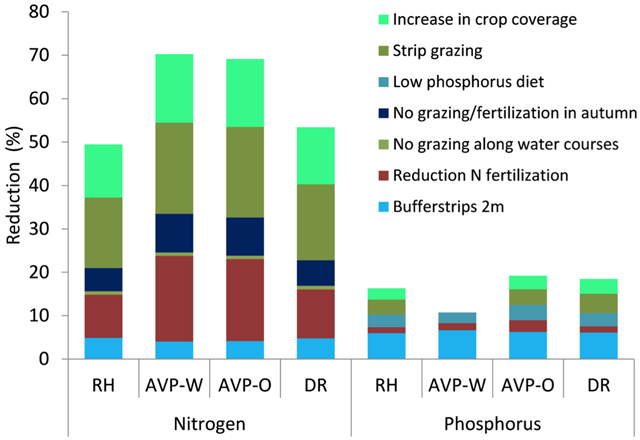
Figure 2 - Relative effects of measures on the losses of N and P to surface water for the four pilot polders (RH: Ronde Hoep, AVP-O: Aetsveld Oost, AVP-W: Aetsveld West, DR: Demmerik). The effect of the measures are cumulatively expressed. Note that when all measures are applied at the same time, the total effect is likely less than the sum of the individual effects due to interactions.

The effect of the scenarios on the reduction of N and P load is dependent on the polder, the nutrient and the measure, but broadly shows the same trend for the four polders (see Figure 2).
The most effective P measures in De Ronde Hoep with regard to run off to the surface water are:
• Buffer zones
• Low phosphorus diet
• Strip grazing (no longer grazing on a grazed part of a plot)
• Increase vegetation coverage on meadow plots

Generally the calculated effects of the measures on the P load of the surface water is small. A reduction of a maximum of 6% per measure. The effectiveness of the measures is significantly higher for N, and can rise to 50-70% for all measures taken together. For comparison, the most effective measures for reducing the N load of the surface water in De Ronde Hoep are:
• Strip grazing
• Increase vegetation coverage on meadow parcels
• Reduction in N fertilisation

Conclusions

The methodology described here makes optimum use of data from agricultural measuring networks available at national level. By using these in the calculation model as described, it is possible to provide insight into soil and fertilisation characteristics, N and P losses at a detailed spatial level. This insight into the characteristics of the water management district, the release of nutrients and the effectiveness of agricultural measures provides a practical perspective on actions for water managers and farmers.

Hans Kros
(Wageningen University & Research, Environmental Research)
Debby van Rotterdam
(Nutriënten Management Instituut)
Arjan Reijneveld
(Eurofins Agro)
Wim de Vries
(Wageningen University & Research, Environmental System Analysis)
Gerard Ros
(Nutriënten Management Instituut)

Summary

Provincial councils, district water boards, municipal councils and various state bodies are working together to reduce the nutrient load of the surface water. Policy evaluations with regard to the nutrient load of surface water are generally carried out at a national scale. These results are less suitable for district water boards, because it is found in practice that there are large differences between polders and drainage units. The use of detailed soil and fertilisation data from agricultural measuring networks and an integrated nutrients model (INITIATOR) makes it possible to provide insight into the soil quality and the agricultural emissions into the water system at landscape scale. In addition, the effectiveness of agricultural measures can be quantified in order to offer the water manager and farmer a perspective on actions.


Literature


De Vries, W., J. Kros, O. Oenema and J. de Klein, 2003. Uncertainties in the fate of nitrogen II: A quantitative assessment of the uncertainties in major nitrogen fluxes in the Netherlands. Nutrient Cycling in Agroecosystems 66 (1), 71-102.

Gies, T.J.A., J. van Os, R.A. Smidt, H.S.D. Naeff and E.C. Vos, 2015. Geografisch Informatiesysteem Agrarische Bedrijven (GIAB) : gebruikershandleiding 2010 (Farms Geographic Information System (GIAB): user manual 2010). Wettelijke Onderzoekstaken Natuur & Milieu (Statutory Research Tasks Nature & Environment), Wageningen, 86 pp.

Groenendijk, P., E. van Boekel, L. Renaud, A. Greijdanus, R. Michels and T. de Koeijer, 2016. Landbouw en de KRW-opgave voor nutriënten in regionale wateren : het aandeel van landbouw in de KRW-opgave, de kosten van enkele maatregelen en de effecten ervan op de uit- en afspoeling uit landbouwgronden. (Agriculture and the WFD challenge for nutrients in regional waters: the share of agriculture in the WFD challenge, the costs of several measures and the effects thereof on the leaching and run-off from agricultural land) Wageningen Environmental Research, Wageningen.

Kros, J., K.F.A. Frumau, A. Hensen and W. De Vries, 2011. Integrated analysis of the effects of agricultural management on nitrogen fluxes at landscape scale. Environmental Pollution.

Noij, I.G.A.M., M. Heinen, H.I.M. Heesmans, J.T.N.M. Thissen and P. Groenendijk, 2012. Effectiveness of unfertilized buffer strips for reducing nitrogen loads from agricultural lowland to surface waters. Journal of Environmental Quality 41 (2), 322-333.

^ Back to start

AGRICULTURAL MEASURES

To provide insight

Knowledge journal / Edition 1 / 2017

Antibiotics in the groundwater beneath areas with intensive livestock farming

The top (dozens of) metres of Dutch groundwater are heavily affected by substances which originate from agriculture. The groundwater also contains antibiotics. This is to a depth of around 25 metres and in groundwater up to 40 years old in areas with intensive livestock farming.

Antibiotics are used on a large scale in livestock farming in the Netherlands. The spreading of manure on agricultural land also allows antibiotics residues to leach into the deep groundwater. We investigated whether antibiotics from agriculture occur in the groundwater, and if so in what concentrations and to what depth. New is that we have not only looked at the depth of occurrence but also the age of the groundwater, enabling us to relate concentrations to the history of antibiotics use.

Because antibiotics are administered to livestock on a large scale, it is important to identify the material streams of antibiotics from livestock farming. Sales of veterinary antibiotics in the Netherlands increased to a maximum of 550,000 kg of active substance in 2007. Usage has decreased considerably since 2007 to around 200,000 kg of active substance in 2014; a reduction of nearly 60%. Around the peak in 2007, 60% of the active substance consisted of tetracyclines, 15% of trimethoprim and sulfonamides, 10% of betalactams, 10% of macrolides and lincosamides and 2% of (fluoro)quinolines (MARAN, 2016). 30 to 90% of the administered antibiotics are excreted by animals and can end up in the environment from grazing animals and spreading of manure. Part of that can leach into the groundwater.
We know little about antibiotics in the groundwater in the Netherlands, apart from a few studies which have not specifically targeted areas with intensive agriculture. On the basis of research in other countries, we expected beforehand that antibiotics would regularly occur in groundwater under agricultural land. Our research therefore focussed on areas with intensive livestock farming. We sampled groundwater in a selection of wells for which an age measurement by means of tritium-helium was carried out in earlier research (Visser et al., 2009). That enables us to establish how long ago the antibiotics leached into the groundwater.

Sampling and analysis

We selected 10 wells in the east of Noord-Brabant, the north of Limburg and the Gelderse Vallei (Kivits, 2016). For the selection, we looked for available wells from the provincial and national monitoring networks for groundwater quality and multi-level wells. These multi-level wells have multiple small filters which gives a detailed concentration-depth profile of the antibiotics concentration. The wells were selected in areas where rain water infiltrates to deeper groundwater, where a time series is available of the groundwater composition, and where the age of the groundwater is known.

Samples for antibiotics were taken in 250 ml glass bottles, and were analysed at the TNO EMSA laboratory using mass spectrometry/liquid chromatography (LC/MSMS) after solid phase extraction (Oasis HLB cartridge). The samples were analysed for 22 veterinary antibiotics from the following groups: tetracyclines, sulfonamides, trimethoprims, β-lactam antibiotics, macrolides, lincosamides, quinolones, nitrofurans and chloramphenicol antibiotics. The analysis method offers low detection limits of 0.10 to 6 ng/l depending on the specific substance.

How deep are antibiotics located, and how old is the water?

We found six types of antibiotics regularly to occasionally: sulfamethazine, sulfadiazine, sulfamethoxazole, lincomycin, chloramphenicol and ciprofloxacin. The concentrations ranged from 0.1 to 18 ng/l. The antibiotics were found at all sample depths, i.e. between 3 and 25 m below surface level. The substances were found in both young water of a few years old and in water that ended up in the subsoil 40 years ago through infiltration of rainwater and dissolved fertilisers (Figure 1). This shows that the detected antibiotics are mobile in the groundwater and do not easily degrade under the conditions in the investigated range of depths. Antibiotics therefore appear to occur structurally in the groundwater and areas with intensive livestock farming, and can leach to a large depth.

Figure 1 - Antibiotics occur systematically in the groundwater under intensive livestock farming areas to a large depth and in water of a high age

Sulfamethoxazole is the substance with the highest detected concentrations (up to 18 ng/l), but we found sulfamethazine most often. These substances therefore appear the most mobile and persistent, which also matches international findings. Sulfamethazine was also found in groundwater that was 40 years old, a period when the leaching of fertilisers was very large, which points to animal manure as the most probable source. The spreading of sewage sludge on maize fields in particular was also common practice in those days, as a result of which sewage sludge can also not be ruled out as a source. Sulfonamides have been used for treating humans since midway through last century.

Processes in the subsoil

Because we sampled in multi-level wells, we can also create concentrations-depth profiles for a number of wells. At three wells, we thereby see a pattern whereby sulfamethazine occurs in all the filters close to the surface, and shows a rapid decline with depth. It is notable that both sulfamethazine and sulfamethoxazole disappear as soon as nitrogen and oxygen disappear from the water and iron in the water increases through the process of denitrification (figure 2). This fits with laboratory research abroad (Banzhaf et al., 2012) whereby these substances degrade biologically in precisely those conditions. We only found sulfamethazine and sulfamethoxazole in nitrate-containing and iron-free groundwater.

Figure 2 - Concentrations of sulfamethazine, nitrate, sulphate, oxygen and iron in a well at Oostrum Limburg.

Not all antibiotics used in livestock farming leach into the groundwater. Antibiotics from the tetracyclines group are the most widely sold in the Netherlands. Tetracyclines were not found in the groundwater in either this study or in research abroad. Tetracyclines adsorb more strongly onto the soil and possibly may also degrade more rapidly. SKB research (2009) has shown that residues of tetracyclines are found in shallow soil.

How serious is it?

The fact that certain types of antibiotics are found down to a large depth in the groundwater under areas with intensive agriculture is no real surprise. However, it had not been explored up to now. The antibiotics occur in types of water which clearly showed traces of over-fertilisation, in the form of high nitrate concentrations, sometimes more than 200 mg/l, and high total dissolved solids. At Eersel antibiotics also occur together with a number of types of pesticides, and we suspect that this will also be the case in many other places. We conclude from the age of the groundwater in which the antibiotics were found that the leaching of antibiotics from agricultural land has been taking place for at least 25 years, and there is no reason to assume that this will not be the case currently. Contamination of groundwater with antibiotics is therefore a generally occurring situation.
Concentrations of antibiotics are low. The question is therefore how serious the presence of antibiotics is. One can argue that the occurrence of these types of substances in the groundwater should be condemned in principle, particularly in the deeper groundwater that may be used to produce drinking water. Set against that is the fact that the substances occur in water that is generally affected by manure and also shows other traces of human influence. Yet the study indicates that where nitrate-containing groundwater seeps into ditches and drains, a small quantity of antibiotics will end up in the surface water with possible negative consequences for organisms or for antibiotic resistance.
The problem of the spread of antibiotics through manuring is more than just a groundwater problem: it can also lead to antibiotic resistance in the soil itself. Consideration could be given to treating slurry in a similar way to waste water. Knowledge of removal methods for antibiotics is available in the Netherlands at - amongst other places - Reinier de Graaf Hospital in Delft (Reinier de Graaf, 2017) and the Delfland Water Authority (Hoogheemraadschap Delfland, 2017). The unwanted spread of antibiotics into the deeper environment is also an additional argument for not spreading unprocessed manure on the land.

Conclusions

The aim of our research was to establish whether livestock farming-related antibiotics occur in the groundwater in areas with intensive livestock farming, and if so in what concentrations and to what depth? That was found to be the case: we found certain types of antibiotics to a depth of around 25 metres and in groundwater up to 40 years old. Six types of antibiotics were found in a concentration range of 0.10 to 18 ng/l. Sulfamethoxazole and sulfamethazine were encountered most often. The study suggests that manuring is the main source. We recommend that certain types of antibiotics should be monitored in the groundwater on a systematic basis, such as in the provincial and national monitoring networks for groundwater quality, for example. It is thereby crucial that the measuring methods offer low detection limits.

Tano Kivits
(TNO Geological Survey of the Netherlands, Utrecht, 2: Copernicus Institute for Sustainable Development, Utrecht University, Utrecht)
Hans Peter Broers
(TNO Geological Survey of the Netherlands, Utrecht)
Henry Beeltje
(TNO Environmental Modelling, Sensing and Analysis (EMSA), Utrecht)
Jasper Griffioen
(TNO Geological Survey of the Netherlands, Utrecht, 2: Copernicus Institute for Sustainable Development, Utrecht University, Utrecht)
Mariëlle van Vliet
(TNO Geological Survey of the Netherlands, Utrecht)

Summary

The shallow groundwater in the Netherlands is heavily affected with nutrients, most of which originate from agriculture. Antibiotics are also used on a large scale in agricultural practice in the Netherlands. This study presents the occurrence of veterinary antibiotics in the groundwater beneath areas with intensive livestock farming. We have sampled groundwater in 10 wells of which the age was determined in previous research. This enables us to establish for the first time how long ago the antibiotics leached into the groundwater. Six of the 22 antibiotics were found in groundwater to a depth of 22 m and with an age range of between 1 and 40 years old. Sulfonamides particularly appear to be mobile in an environment in which oxygen and/or nitrate occur in the water: deeper in the subsoil where dissolved iron occurs, the concentrations are equal to 0. The study shows that antibiotics are present in groundwater and agricultural areas and that manuring is the most logical source.


References


Banzhaf S., Nödler K., Licha T., Krein A. and Scheytt T. (2012). Redox-sensitivity and mobility of selected pharmaceutical compounds in a low ow column experiment. Science of the Total Environment, 438:113-121.

Hoogheemraadschap Delfland (2017): https://www.hhdelfland.nl/ondernemer/innovaties-in-de-praktijk/hergebruik-van-afvalwater-1

Kivits T. (2016). Antibiotics in Dutch groundwater, The occurrence of antibiotics in shallow groundwater in areas with intensive livestock farming, MSc thesis, TNO, Utrecht.

MARAN (2016). Monitoring of Antimicrobial Resistance and Antibiotic Usage in Animals in the Netherlands in 2015. Central Veterinary Institute, Wageningen.

Reinier de Graaf (2017): https://reinierdegraaf.nl/algemeen/over-reinier-de-graaf/duurzaam-ziekenhuis/pharmafilter/

SKB (2009). Antibiotica in de bodem, een pilotstudie (Antibiotics in the soil, a pilot study), PP8348, Gouda.

Visser A., H.P. Broers, A. Vonk and B. Veldstra (2009). Verbetering grondwaterkwaliteit aangetoond door leeftijdsbepalingen (Improvement in groundwater quality demonstrated by age measurements). H2O 23:29-32.

^ Back to start

ANTIBIOTICS

Groundwater heavily affected

Knowledge journal / Edition 1 / 2017

Big ecological gains from small-scale restoration measures?

Smart application of small scale measures can result in big ecological gains for aquatic life in streams and can contribute to the realization of Water Framework Directive objectives.

The Dutch Water boards aim to achieve a good ecological status for all surface water bodies over the coming years. Costlyrestoration projects, such as stream remeandering, are initiated to achieve this goal. However, to date the ecological results are often disappointing. Research shows that small-scale instream measures may provide a cost-effective alternative. The application of such measures has not yet been translated into practical guidelines for Dutch streams. The project ‘Small-scale restoration measures for streams in the province of Noord Brabant’ (‘Kleinschalige maatregelen Brabantse wateren’) (2014-2020) seeks to provide this translation, funded by the Aa en Maas, de Dommel and Brabantse Delta Water Boards and the province of Noord-Brabant.

This project, which consists of reviewing existing scientific literature in combination with field studies, comprises six small-scale restoration measures, namely: adjusted mowing of water vegetation, restoration of riparian shading, introducing dead wood, reinstatement of natural flow regimes, sand suppletion and gravel addition. The ecological effects of these measures in the Dutch streams are being examined in monitoring and field-experimental studies. This article describes important finding from the literature review, presents the first results from the field studies and provides management recommendations.

Smart Ecological management of water vegetation

Under near-natural conditions the unshaded reaches of lowland streams contain species rich vegetations, with bare substrate, pioneer species and long-living plant species occurring in a mosaic. Currently, in the Noord Brabant streams, one generally encounters high biomass species-poor vegetations clogging the waterways, for example monocultures of Callitriche sp.. Knowledge of plants and their distribution in the waterways, in relation to the abiotic factors, is the starting point for effective and species-oriented maintenance. By adjusting the time and frequency of mowing to the development pattern of the target species, instead of mowing in fixed periods during the year, clogging of the waterways can be reduced, possibly stimulating plant diversity.

Cutting water vegetation in stream reaches as blocks or strips instead of uniformly, has a positive effect on aquatic life. The uncut vegetation provides a source of seeds and acts as a feeding, refuge, overwintering and oviposit site for macroinvertebrates and fish. Also, it could act as a site for nutrient cycling. Flow obstruction and with that flood risks are negligible, as flow resistance of these structures is minor.

Only a narrow flow-path has been mown in the Lage Raam stream in Noord-Brabant for over 10 years. A comparison of this ‘flow-path reach’ with a reach that is mown uniformly shows that the former method results in a higher substrate heterogeneity and a higher macroinvertebrate richness in spring. Probably the observed patterns results for winter high flows, whereby flow-path mowing results in more instream structure, generating flow differentiation, and with that substrate diversity, in the reach and an increased refuge availability. In the reach where flow-path cutting is carried out a more gradual transition between water and land also leads to higher plant species diversity in the littoral zone. Further research on the ecological effects of mowing is currently being carried out in the Vlier, the Groote Aa and the Oude Leij.

The current velocity in the mown channel increases with flow-path mowing. Theoretically, a point can be reached where mowing can be reduced, given that the growth rate of plants decreases at an average flow of approximately 20 cm/s. However, flow rates at which plants disappear almost entirely are never reached in the Dutch lowland streams. Therefore, flow-path mowing alone is not sufficient to permanently minimize water plant biomass in streams. Riparian shading provides an additional management option.

Riparian shading

Vegetation alongside streams lowers the water temperature, reduces radiation, provides food and creates habitat (leaves and wood in the stream, land habitat for adult water insects), provides nutrient transformation sites and stabilizes stream banks. Riparian shading can result from natural seedling establishment, but also by actively planting trees.

The effects of shade on stream ecosystems have been analyzed using monitoring data from the Noord Brabant Water Boards over the past 10 years. It was found that riparian trees have a positive effect on the aquatic fauna, particularly through generating instream habitat. In order to inhibit water vegetation development and cool stream water temperature heavy shade (>70%) is required and one must strive for shaded stretches which are as long as possible.

Riparian trees (such as willow and alder) must be 2-3 times as high as the width of the stream. Tree branches should preferably reach over the water, or the entire tree should reach over the water at an angle of 10-20o., The position of the stream with respect to the sun should be considered when planting new vegetation; trees on the southern and western banks provide most sunlight reduction. Streams with a north-south orientation require a wider forested area along the stream to achieve comparable light reduction than streams which are oriented east-west.

Canopy gaps provide sites were light-preferring vegetation can thrive. A ratio of approximately 75% wooded and 25% open areas is probably optimal, whereby the lengths of the open parts should be equal to the average riparian tree height.

The growth of waterplants in the Hooge Raam stream and the Keersop stream was examined in reaches which varied in terms of shading, tree species, , tree height and age of the trees. The analysis showed that shade is an effective tool in reducing the development of water vegetation. In the Hooge Raam stream a 40 to 50% light reduction was needed in order to halve the water vegetation cover. For the Keersop stream a light reduction of 50 to 75% was needed to obtain a similar effect on the water vegetation. The difference between the streams was probably caused by the orientation of the streams. Furthermore, the study showed that a high light reduction could be achieved within a periode of several years. In the Keersop a five-year old riparian buffer strip containing willows and alders was found to be just as effective as a woodland that was several decades old.

Dead wood

The introduction of dead wood is increasingly being used in stream restoration. The choice of wood type is linked to the aim of the restoration measure (e.g. habitat for fauna, counteracting channel incision) and function of the stream. Logs placed on the stream bottom are particularly suitable to prevent erosion of the streambed, but provide only Tree stumps that are partly embedded in the stream banks but protrude in the stream channel are suitable in places where, for example, canoeing takes place. Both methods provide local heterogeneity in terms of flow and habitats, although stumps have a higher refuge value for fish and create a higher flow differentiation and thereby habitat heterogeneity. Instream dead woody debris dams, consisting of braided branches and logs of different sizes provide the largest flow and habitat heterogeneity and are especially effective in capturing coarse particulate organic matter, resulting in an approximation of the 30-50% organic material content of near-natural lowland streams. It is important that the woody debris dams do not exceed the base flow water column height to prevent too high flow resistance or damming effects during high flows. In ecological terms, braided woody debris dams offer the greatest benefit for stream ecosystems.

Different types of dead wood structures were placed in the Snelle Loop stream in 2012. Preliminary results show that wood structures have an effect on the macroinvertebrate species composition, but the number of species with a clear preference for one type of structure was limited. Large scale effects (e.g. flow regime) between years were more important in determining the community composition, overriding the local effects of the wood structures. The ecological effects are currently being studied in more detail in the Lactariabeek, the Beekloop and ‘t Merkske streams.

The use of tree species with relatively hard wood, such as oak and beech, results in woody debris patches which are more durable in comparison to the fast decaying ‘soft’ wood species such as willow and poplar. The latter also have the tendency to sprout when fresh wood is deployed.

Reinstatement of natural flow regimes & sand suppletion

The key factor for a diverse species community in streams is continuous flow. Flow-preferring species disappear within one week after flow ceases. Besides, changes also occur in environmental conditions during stagnation, for example, accumulation of fine material (siltation) associated with oxygen depletion because of increased biological oxygen demand.
The reinstatement of natural flow regimes with its associated natural water level variation enhances vegetation diversity along streams because optimal conditions for seedling establishment arise. A more natural flow regime within the boundaries set by other functions in the watershed can be achieved by decreasing the dimensions of the channel in combination with creating more space for high-flow inundations in the stream valley.
This can be achieved by supplying excess sand to incised streams in combination with measures to prevent bed erosion (e.g. dead woody debris addition); a using a small ‘sand motor’ channel depth decreases and the stream is reconnected to its former stream valley riparian zone or floodplain.

Gravel beds

Gravel beds act as spawning substrate for many species of stream fish and are inhabited by characteristic macroinvertebrates. Gravel beds can be introduced to streams as a restoration measure to provide habitat for these species Nonetheless, this only make sense if the flow conditions meet the requirements of the targeted species, and if the gravel beds can maintain themselves on the longer term. Position within stream, as well as the composition and the quantity of material are important determinants of restoration success.

Introduction of gravel is rarely used as a restoration measure in the Netherlands. Gravel has been introduced in the Tongelreep stream, were its function as spawning area for fish and habitat suitability for macroinvertebrates is investigated. In addition, it is measured whether or not the gravel beds remain intact by monitoring location, surface area as well as internal structure. The accumulation of fine material (sand, fine organic material) is a particular point of interest, since this may fill up the interstitial spaces within the gravel bed and therewith may nullify the unique properties of this substrate for, amongst others, fish eggs.

Prioritising measures

Which measure best can be applied in a stream depends strongly on the restoration goals and the site-specific conditions. Based on the literature study most restoration measures have been found to serve multiple goals, often acting on combination of biological, hydrological and morphological aspects. The only exception is the introduction of gravel, which is a purely species-oriented measure. The difference in the effect of the measures on higher spatial scales is shown in figure 2.

Figure 2 - The measures differ both in the scale on which they have effect, and in the use of space.

The term ‘small-scale measures’ does not imply that the scale of the intended effects is also small - it refers solely to the scale of the initial measure itself. The studied measures have a self-reinforcing effect: they initiate natural processes and simulate the overall functioning of the stream ecosystem. This positive effect then radiates to its surroundings, not only to upstream and downstream, but also perpendicular to the stream into the stream valley. Of all the management options studied, riparian shading is the most effective small-scale measure; a large radiating effect can be achieved with a relatively limited use of space. Given the intensive land use in the province of Noord Brabant, realizing buffer strips of riparian forest along streams is the most easily achievable option.

In this project, scientific literature on the selectedsmall-scale measures has been translated into fact sheets, and an integrated quantification of the effectiveness of these measures is being compiled through monitoring projects and field experiments in Noord Brabant. The Knowledge Network for Restoration and Management of Nature in The Netherlands (OBN) will follow up on this project with the study ‘Modified management and maintenance and small scale measures in streams’ (‘Aangepast beheer en onderhoud en kleinschalige maatregelen in beken’). Within the Foundation for Applied Water Research (STOWA) Building with Nature (Bouwen-met-Natuur) working group special attention will be paid to a cost benefit analysis of these small-scale restoration measures.

Bart Brugmans
(Water Board Aa en Maas)
Ralf Verdonschot
(Wageningen Environmental Research)
Monique van Kempen
(Province of Noord-Brabant)
Ineke Barten
(Water Board De Dommel)
Sandra Roovers
(Water Board Brabantse Delta)

Background picture: Mowing of Callitriche sp.

Summary

The Dutch Water boards aim to achieve a good ecological status for all surface water bodies over the coming years. Costly restoration projects are initiated to achieve this goal. However, to date the ecological results are often disappointing. By smart deployment of small-scale restoration measures, in which small-scale refers to the scale of the initial measure itself, not to the scale of the intended effects on the stream ecosystem, there are opportunities to contribute to the Water Framework Directive goals. Currently six restoration measures are being investigated by means of literature reviews, monitoring and field experiments. Insight has been obtained already into the effects on the ecological quality of each type of measure, and this has been translated into management recommendations. Which measure can best be used in a specific situation depends strongly on the stipulated objectives and local conditions.

^ Back to start
ECOLOGICAL GAINS

Small measures big results

Knowledge journal / Edition 1 / 2017

RAMS in the water chain: how asset management contributes to effectiveness

The RAMS method offers an objective substantiation of the operational values of facilities and is therefore a useful tool for determining the balance between cost, risk and performance.

The National Administrative Agreement on Water (Nationaal Bestuursakkoord Water), the Delta Programme and the Water Framework Directive have resulted in the water sector’s responsibilities growing, without budgets being increased. In addition, there is little appetite among the public for increases in charges.
The water sector is trying to find solutions to the challenge of ‘doing more with less’ through more intensive collaboration, the use of innovations and the optimum exploitation of infrastructure (assets). Hence the postponement of investments appears to be an attractive strategy. But are the risks acceptable? The need for redundancies in the design of new systems in conjunction with smarter maintenance concepts also offer potential savings. Here too the question is: what is the effect and is the risk acceptable?
The idea of asset management has been developed to answer these questions. Tools are thereby used to match the balance between cost, risk and performance to the organisation’s vision and strategy.
This article explores what possibilities are offered by the RAMS method in order to answer the questions posed above. RAMS stands for Reliability, Availability, Maintainability and Safety. We will first explain the methodology, characteristics and uses of the RAMS method. We will then describe three examples where the RAMS method has been used, and identify the learnings.

Availability and reliability

Availability is one of the operational values of - for example - drinking water and waste water plants and has links to performance, risk and cost. The availability of a facility can be determined quantitatively using the RAMS method. The requirements with regard to availability can thereby be objectively substantiated. The method thereby also provides information about the reliability, the need for maintenance and the safety of a facility.
Rijkswaterstaat uses the method extensively for risk inventories and maintenance management on civil engineering structures and dikes, for example. Additional aspects can be added to the analysis, such as security, environment and economy. This article particularly focuses on the first two components of RAMS: availability and reliability.

Figure 1 - Changes in the likelihood of failure over time, including the effect of infant mortality failures, normal use and wear out failures ( the ‘bath tub curve’).

The RAMS method can be used for a specific moment in time or for the entire lifespan. Equipment has a varying failure characteristics. The ‘bath tub curve’ in figure 1 simulates both infant mortality problems and an increased risk of failure due to ageing. Other equipment manifests a constant or steadily rising failure characteristic. This makes it possible to identify when the system under consideration will no longer comply with the minimum availability or reliability requirements.

Critical components

In addition to the unavailability and reliability of (parts of) the system being determined in an objective way, the analysis also clearly shows the most important causes. This provides opportunities for specific preventative measures. Critical components can be designed differently or be maintained more intensively in order to improve the availability. This allows very effective designing, construction or renovation: only what is necessary is replaced; less urgent components require less attention.
A RAMS study can also be carried out in order to determine the unavailability as a result of planned maintenance. The impact and financial consequences of particular maintenance strategies can also be examined. It is even possible to calculate how much often or less often the maintenance department needs to attend at night for an urgent fault.

Figure 2 - Life-cycle phasing and potential role of RAMS studies.

Potential during the life-cycle

RAMS offers added value at various points in the life cycle, see also figure 2:
• Management phase:
- determining the moment of (re-)investment;
- determine the scope of works;
- striking a balance between Service Level Agreements with suppliers, spare parts on site or redundancy in the design.
• Tendering:
- in preparing works and putting them out to tender: clear formulation of functional requirements.
• Design:
- striking a balance between redundancy or more intensive deployment of personnel;
- striking a balance between investment in hardware, software or maintenance work;
- demonstrating that Final Design complies with availability requirements;
- optimisation of total cost of ownership (TCO) in the design by finding the optimum balance between investments and operational costs for the same performance.
• Construction:
- Demonstrating that Construction Design complies with availability requirements.

The RAMS method has been used on various water chain projects, of which three are highlighted. The approach to these projects was as follows:
Definition of function and failure: the function requirements which the water treatment plant must meet are required in order to determine the definition of failure. Failure occurs if the stipulated function requirements are not met (intake requirements, effluent quality, but also aspects such as safety or nuisance for the surroundings).
System decomposition: the water treatment plant is divided into structural components and structural elements, depending on the required level of detail. The level of detail is dependent on the required result and at what level of detail failure data is available.
Determining failure behaviour: the failure mechanisms and associated risk of failure are determined for each component. Good manuals are available for this (e.g. OREDA, RWS manual), supplier data or fault data.
Failure Mode Effect and Criticality Analysis (FMECA): the consequences of the failure mechanisms must be determined. This requires knowledge of the process and the interactions.
Quantification of restore time: the restore time is very important for calculating the availability. The restore time consists of identification time, mobilisation time, analysis time, delivery time, repair time and start-up time.
System analysis: the information from the steps of the process listed above is incorporated in a calculation model from which the results are generated. This can include the use of fault tree analysis.

E&I system Veenendaal water treatment plant

A RAMS analysis was used to investigate whether the replacement of the electrical system and instrumentation (E&I) of Veenendaal water treatment plant (Vallei & Veluwe water board) could be deferred by 10 years. The E&I of Veenendaal water treatment plant was delivered in 1994. Elements including the PLCs were replaced later. A replacement (investment: € 1.4 million) was scheduled for 2013. On the basis of experiences with (even) older E&I systems at other water treatment plants, a RAMS analysis was used - at the water board’s request - to identify the additional risk if no renovation were to take place. The calculated unavailability was high in the event of deferred investment; however, this was largely caused by a small number of components (e.g. emergency stop relay) with a long delivery time. However, the availability and reliability did not decrease over the next 10 years. The results meant that the re-investment was postponed, in conjunction with a few preventative management measures. A limited number of spare parts are held in stock and a few critical components were replaced.

Scheveningen pumping station

Dunea commissioned a RAMS analysis as a second opinion on 3 previously identified bottlenecks in the reliability of supply of Scheveningen pumping station. It was advised in an earlier phase that the powdered carbon dosing, PA system and the energy supply and control of aeration and filtration should be constructed redundantly in order to comply with the reliability of supply requirement. A RAMS analysis showed that, apart from the redundant execution of the primary server room, unavailability could be substantially reduced through simple measures such as guaranteeing good lightning conductors and the removal of surplus equipment that posed a fire hazard.

Leiden South-West waste water purification plant

A RAM study was used in connection with the renovation of Leiden South-West waste water purification plant (Rijnland polder authority) in order to record the current performance, identify the critical components and thereby establish the scope of the renovation. It was found that the failure behaviour of the water treatment line is dominated by a small number of components with a long repair time or high failure frequency: the 18-year-old blowers and the level change sensors on the screen waste removal. In the case of the sludge treatment line the unavailability is distributed across many more components with a shorter repair time. The improvement measures are consequently also different. By keeping a limited number of components in stock, the unavailability is reduced by two thirds due to the reduction in delivery time. The findings of the study contributed to establishing the scope and budget of the renovation project.

Learnings

In carrying out the projects we encountered a number of obstacles which are specific to the water sector. Practical solutions have been found for these. Learnings include:
• A RAMS analysis presupposes a black-and-white situation: a system fails or does not fail. ‘Restricted capacity’ is therefore not a possible outcome, ‘failure to comply with the intake requirement’ is. This emphasises the importance of a good failure definition.
• Some processes are very ‘slow’, such as sludge digestion. The failure of equipment will only then translate into a process fault and therefore functional failure after some time. It can also take some time after the fault is rectified before the process has also been restored.
• Annual average effluent values need to be translated to instantaneous values in order to determine the failure threshold.
• There are different critical components for rainwater flow than for dry weather flow treatment. This needs to be taken into account in the total unavailability.
• The quality of the results is dependent on the input data. Only with good failure data is it possible to gain a clear insight into the system’s RAMS performance.
• A RAMS analysis prepared in order to determine the performance of a system over its technical lifespan can certainly not be used directly to calculate the residual risk if renovations are postponed.

Conclusion

In the context of cutting costs, the smart planning of re-investments is an interesting strategy for businesses in the water chain. The RAMS method offers an objective substantiation of the operational value of reliability, and is therefore a useful tool for determining the balance between cost, risk and performance. In a practical sense, it provides a good basis for substantiating the need for re-investments or the postponement of such investments. It can also be used to strike a balance between hard and soft redundancy, maintenance strategies and service contracts so that equivalent alternatives are considered in the TCO.

Anthonie Hogendoorn
(Arcadis)
Eric van der Zandt
(Arcadis)
Petra Ross
(Arcadis)

This article was produced with the assistance of Dunea drinking water company, Rijnland waterboard and Vallei en Veluwe waterboard.

Summary

The RAMS method offers water authorities, water supply companies and contractors a practical tool for making the right choices; in the design, but also in the maintenance of systems. It can be used to limit costs: the method provides a firm basis for substantiating the need for redundancy in designs and to establish the intensity and scope of maintenance and renovation. It also offers means for comparing and optimising maintenance concepts and improving spare control.

^ Back to start
RAMS

A useful tool

Knowledge journal / Edition 1 / 2017

Risk of climate change and water diversion for the ecology of the Meuse

A reduced water flow in the Meuse can have a negative impact on the river’s delicate ecology. Climate change will thereby play an important role in the future, as may the diversion of water of the Rur to a limited extent.

The European Water Framework Directive stipulates that all inland waters in the European Union must be in a good ecological status. Low water flows make it difficult for managers to implement this. Periods of water scarcity are often accompanied by high water temperatures and higher concentrations of pollutants in the water. Climate change will probably lead to more frequent periods of water scarcity.
The Rur (Rur in German), an important tributary of the Meuse in Germany, makes a significant contribution to the water flow in the Meuse downstream of Roermond. There are plans in Germany to divert part of the water of the Rur to former brown coal quarries, as a result of which less water will be deposited in the Meuse.
An exploratory Dutch-German study has examined the relationship between the flow, the water temperature and water quality during low water flows in the Meuse and the Rur. The study examined what influence climate change and the water diversion would have on the water flow and the water quality in the Meuse's mainstream.

As a rain fed river, the Meuse has a highly variable flow and is sensitive to both flooding and water scarcity. Sufficient flow is of ecological and economic importance.
For ecological reasons, the target for the Border Meuse is a minimum flow of 10 m3s-1. This water flow cannot be maintained during dry periods. From an economic perspective, it is important that shipping is always possible on the Juliana Canal, amongst other things. A water flow of around 20 m3s-1 is always required for this, to compensate for lock losses at Born and Maasbracht. During dry periods the water that has ‘escaped’ from the canal through locks is pumped back in.
The Rur comprises around 7% of the Meuse’s total catchment, but has a system of reservoirs with which it has a significant influence in the mainstream flow, particularly in situations with low water flow. The reservoirs in the Rur are relatively deep and contain cool water.
Figure 1 suggests that this has a cooling effect on the Meuse at lower flow levels. The average low water flow in the Meuse is around 100 m3s-1 whilst the Rur has a relatively constant water flow of 20 m3s-1. However, the Meuse's flow is regularly lower, as a result of which the Rur’s influence is frequently greater. On very dry days the Rur can supply up to 80% of the Meuse's water flow.

Figure 1 - Water temperature difference derived from observations at Linne and Roermond, before and after confluence, in April-September of the year 2011-2013. The X axis shows the ratio between the flow in the Rur and the Meuse. The temperature differences on the y-axis are averages across 50 measurements (after sorting by the ratio of the flows). The lines show the standard deviation.

Study method

The aim of the study was to carry out an initial exploration of the influence of the Rur on the flow, temperature and quality of the Meuse in various situations, taking account of the aforementioned factors. The following questions were addressed in the study: 1. What contribution does the Rur make to the Meuse's flow in periods of low flow? 2. What is the effect of the comparatively cool water from the Rur on the temperature of the water in the Meuse? 3. What contribution does the Rur make to the Meuse's water quality in periods of low flow?

Four different scenarios were developed which take account of the various situations that can arise as a result of the anticipated climate change and the existing plans for diverting the water of the Rur:
• The current situation (REF - reference scenario)
• The future situation under climate change, without water diversion (CC)
• Situation in which water from the Rur is diverted, without climate change (DIV)
• Combination of water diversion and climate change (CCDIV)

Figure 2 - Number of days that a particular water temperature is reached in the Meuse upstream (up) and downstream (down) of the discharge of the Rur into the Meuse for the various scenarios

The model calculations for hydrological flow developed within the Interreg project AMICE (Adaptation of the Meuse catchment area to the consequences of climate change) (amice-project.eu/), which was completed in 2013, were used in the study. The existing national (French, Belgian, German and Dutch) climate scenarios were used for this in AMICE. These were already well-matched to the characteristics of the catchment area. Alongside the flow of the Meuse and the Rur calculated within AMICE, the air temperatures from the transnational scenario were also used.
A strategy was developed for the diversion of the water from the Rur to the brown coal quarries which assumes a maximum diversion of 2.5 m3s-1 at a water flow in the Rur of at least 12.5 m3s-1 at Jülich. At lower water flows less water is diverted, and the diversion is stopped at a flow of less than 5 m3s-1.
Calculations were carried out on the basis of the AMICE scenarios, the flow calculations and the water diversion strategy, using statistical models. The model developed by Van Vliet et al. (2011) was used for estimates of the water temperature, which links water temperature to air temperature and flow rate in a non-linear relationship and thereby takes account of the somewhat delayed response of water temperature to air temperature. The model developed by Weiss (1970) was used to estimate oxygen solubility. Chloride concentrations were derived using the flow relationship as derived by Van Vliet and Zwolsman (2008).
Temperature and oxygen concentration are important for the ecological condition of the Meuse. The chloride concentration was selected as an indicator for the concentrations of dissolved pollutants in the Meuse. The calculations were carried out for the meteorological summer half year from April to September, the months with the lowest water flows and highest water temperatures.

Results

Under the ‘dry’ AMICE scenario used, the water flow is diminished by 7-20% in 2050 compared to the reference. The effect of climate change is much greater than the effect of the water diversion. Nonetheless the effect of the water diversion is significant. In the reference situation the number of days on which the Rur provides 20% of the flow is reduced by the water diversion from 31 to 23 days (23%). Under climate change it is reduced from 68 to 59 days (13%).
The reduced water flow leads to an increase in chloride concentrations of 15-20%. The changes in the air temperature can lead to an increase in water temperature of 1.5-2.5 oC. The oxygen solubility declines by 4-10% as a result. All these changes have a negative effect on the delicate ecological condition of the Meuse. The effects are particularly attributable to climate change. On average the effects of the water diversion are relatively small. A detailed description of the results can be found in Pyka et al. (2016).

One comment to make on this study is that the hydrological models used reflect the average trends well, but are possibly less suitable for simulating extreme low flow situations. For example, whilst flows of less than 5 m3s-1 have been measured, these (rare) values do not appear in the model calculations for any of the scenarios. The time horizon for this study is also restricted to 2021-2050, a period in which climate change is still relatively limited. Set against that is the fact that the dry scenario that has been used can be deemed a worst case scenario.

Conclusions

The study confirms that rising temperatures and longer periods of drought as a result of climate change are accompanied by higher water temperatures and concentrations of pollutants in the Meuse and the Rur. This has a negative effect on water quality, and therefore the ecological condition. In such situations the Rur has a positive effect on the water quality in the Meuse. The diversion of water to the brown coal quarries has - on average - a limited impact on this interaction. On very dry days when the Rur still has a water flow of more than 5 m3s-1 the impact of the diversion can be significant.

To create good ecological conditions, the water managers Rijkswaterstaat, Roer en Overmaas water board and Wasserverband Eifel-Rur must harmonise the lock management, the water extraction and the water distribution between the Rur and Meuse well. The international Meuse commission can thereby play a coordinating role. This commission will include the results of the study in its ongoing work.

This study indicates that the consequences of climate change and the water diversion need further research. An assessment must thereby be made of the effects in the longer term (to 2100) and also of the influence of other tributaries on the Meuse's water flow and quality.

Jos Timmerman
(Wageningen Environmental Research (Alterra), the Netherlands)
Cor Jacobs
(Wageningen Environmental Research (Alterra), the Netherlands)
Christiane Pyka
(RWTH Aachen University, Germany)
Heribert Nacken
(RWTH Aachen University, Germany)

Summary

An exploratory Dutch-German study examined the relationship between the volume, the water temperature and water quality during low water levels in the Meuse and the Rur in various scenarios. The results confirm that rising air temperatures and longer periods of drought as a result of climate change will be accompanied by higher water temperatures and concentrations of pollutants in the Meuse and the Rur. This has a negative impact on achieving the targets of the Water Framework Directive. The German plans for diverting water from the Rur to the brown coal quarries has a limited impact on this interaction on average, but the effect can be significant on individual days. Close contact between the water managers is required to ensure good water quality.


Sources used


Pyka, C., C. Jacobs, R. Breuer, J. Elbers, H. Nacken, H. Sewilam and J.G. Timmerman (2016). Effects of water diversion and climate change on the Rur and Meuse in low-flow situations. Environmental Earth Sciences 75(16): 1-15. http://dx.doi.org/10.1007/s12665-016-5989-3

Van Vliet, M.T.H. and J.J.G. Zwolsman (2008) Impact of summer droughts on the water quality of the Meuse river. J Hydrol 353(1–2):1–17. doi:10.1016/j.jhydrol.2008.01.001

Van Vliet, M.T.H., F. Ludwig, J.J.G. Zwolsman, G.P. Weedon, P. Kabat (2011) Global river temperatures and sensitivity to atmospheric warming and changes in river flow. Water Resourses Res. doi:10.1029/2010WR009198

Weiss RF (1970) The solubility of nitrogen, oxygen and argon in water and seawater. Deep Sea Res Oceanogr Abstr 17(4):721–735. doi:10.1016/0011-7471(70)90037-9

^ Back to start

THE MEUSE

Effect of climate change

Knowledge journal / Edition 1 / 2017

Quagga mussel impeding artificial infiltration at WML

The infiltration banks in De Lange Vlieter reservoir are getting clogged more rapidly due to the strong growth in the number of Quagga mussels. Research showed that pre-treatment would mean that the banks need cleaning less frequently.

De Lange Vlieter is a gravel pit filled with water from the river Meuse of around 125 hectares which drinking water company NV Waterleiding Maatschappij Limburg (WML) uses as a reservoir. This reservoir is separated in a preliminary and a main reservoir by a synthetic screen. During the annual inspection it was found that that the condition of this screen has deteriorated , and that the water-permeable banks of the reservoir were silting up. This has a major impact on both the extraction of water through the adjacent extraction wells and the level of the groundwater.
WML had three questions: Is it a good idea to install a new partition structure? Can that be the same screen or a version which requires less maintenance? And can the system be made more robust at the same time, with less clogging of infiltration banks and with optimisation of the destratification process?
Around twenty-five percent of WML’s total water production in north and central Limburg takes place in Heel. During normal operations the main reservoir of De Lange Vlieter is filled with water from the river Meuse passing the preliminary reservoir. After spending around one and a half to two years in the reservoir and after soil passage this water is then pumped up by bankfiltration wells and is further processed into drinking water. If analysis shows that the quality of the Meuse water is inadequate, the intake is stopped. The stock available in De Lange Vlieter allows continuation of production for a few weeks. If the water level drops below a certain level, WML stops the bank filtrate extraction from the reservoir and switches over to the backup: extraction of deep groundwater at the Heel location and increasing production at other pumping stations within its distribution system in central Limburg.
Optimally functioning bank filtration in De Lange Vlieter is crucial in this process. WML therefore thoroughly cleans the infiltration banks roughly every five years using a dredger or divers. However, all that is very expensive and time-consuming.

New influences

In order to meet the demand for drinking water in the supply area, WML pumps up around 15 million cubic metres of water a year around the reservoir. However, what could not be anticipated 15 years ago was that silt and the arrival of the Quagga mussel would have such major consequences for the permeability of the soil and the banks.
The faeces of this invasive exotic species forms a layer of slime which is very difficult for water to permeate. The mussels also form layers tens of centimetres thick on the plastic screen between the preliminary and main reservoir, which is therefore breaking and also threatening to tear.
In an interactive research project, a multidisciplinary team investigated the optimisation of the management and design of De Lange Vlieter. The finding that the screen would have to be replaced after 15 years did not come as a surprise, but there were other elements: the Quagga mussel, bank blockage, doubts about the quality of sediments on the reservoir bottom, possible new contaminations of Meuse water and the threat of drying-out as a result of falling groundwater levels. The bottom and banks of the reservoir are not only being blocked by the settlement of (in)organic material, but also by the mussels’ excretions. They have now established such an extensive presence that they are consuming a large proportion of the production of algae. The large supply of food means that the mussels are thriving, the algae population is being reduced and water clarity is improving. But the bank impermeability is increasing further.

Declining infiltration

Measurements confirm a reduction in the infiltration, the extraction of more groundwater and a fall in the groundwater level. The ratio between infiltration from De Lange Vlieter to the groundwater and the quantity extracted had fallen to 75% in 2007. After the banks were cleaned, this rose back to around 95%, after which it had then fallen to 75% again by 2011. A new cleaning campaign restored the ratio to 90%. Periodic campaigns to clean the banks are expensive and cause problems with the storage and processing of the silt. If the method of operation remains unchanged, these problems will increase due to the ever greater accumulation of nutrients and biomass.
An extensive survey was intended to provide insight into all the aspects which played an essential role in this process. In conjunction with this, WML organised a brainstorming session with internal and external participants. Were all the problems being identified? What solutions were available? The screen needed replacing anyway; why not then tackle the situation thoroughly, modify the entire intake process and at the same time solve other problems?
A water and mass balance sheet showed that phosphorus from the Meuse is accumulating in sediments on the bottom of the reservoir and in biomass. Over the period 2000 to 2013 around 105 tonnes of total phosphorus and 930 tonnes of floating material ended up in the reservoir. Of this, around 13% and 17% respectively left the reservoir again through the infiltrated water. The remaining 87% and 83% were left behind in the reservoir. Sediment samples from the infiltration banks show blockage by biomass. On the infiltration banks with mussels, organic material was found in the ground to a depth of 2 cm. This material was not found on the cleaned banks without mussels. The permeability of the soil with the organic material was found to be significantly lower.

Explosive growth

The Quagga mussel was first encountered in 2009. Measurements in 2012 show that the density had already grown to a number of around 12,000 per square metre. Phytoplankton (algae) in De Lange Vlieter constitute the main source of food for the mussels. However, when filtering water the mussels also take up floating material. The inedible parts are encapsulated in slime and excreted as pseudo-faeces. Research from 2013 shows that the growth of the phytoplankton in De Lange Vlieter is phosphorus-restricted, which means that the input of total phosphorus is an important control parameter for managing the density of mussels and hence the quantity of faeces and pseudo-faeces. Jar tests and settlement tests show that it is very possible to remove phosphorus and suspended solids using a flocculant, a flocculator and a settlement reservoir before the water enters the main reservoir. When the flocculant ferric chloride is dosed in 4 mg/l Fe, both fall by around 90%.

Figure 1 – Schematic representation of factors that influence the phosphate concentration in De Lange Vlieter.

Geohydrological model

Geohydrological model research was used to simulate clogging of the infiltration banks. Incorporation of the clogging process in the model was an innovation. This allowed for a good prediction of future developments, which supported the decision-making about the cleaning of the infiltration banks and a pre-treatment. Based on the results of the jar tests, a translation was made to the anticipated water quality, the effect on the mussel population and the effect on the production of clogging material. The conclusion is that the quantity of clooging material will fall by around a factor of 8. The geohydrological research shows that the better water quality leads to less lowering of the groundwater table and a considerably lower cleaning frequency.

Figure 2 – Calculated effects of the Heel bank filtrate extraction and groundwater level in the adjacent nature area - with and without pre-treatment of Meuse water.

Controllable nutrient-poor process

The aim is to move from a biological process which is hard to predict to a controllable nutrient-poor process. The research has shown that the solution lies in adding a pre-treatment. Where the preliminary reservoir was previously mainly intended for the analysis phase and as a buffer, pre-treatment is now added to that as a third important task. By creating a flocculator with a subsequent settlement zone in the preliminary reservoir, nutrients and suspended solidswill settle there. That directly influences the food chain. Removing the mussels completely is impossible, but by negatively influencing their living conditions, they will develop and reproduce less quickly. The approach adopted in this process in a context with a reservoir with infiltration banks affected by clogging is unique in the world.
In order to finally reach a fully substantiated advice on the potential solution, a Multi Criteria Analysis was carried out. The input from all disciplines (including the cleaning frequency, the investment and operation costs and the risks) thereby led to the decision to dose a flocculant. That is now being prepared: dosing of the flocculant iron chloride, modifications to the preliminary reservoir with a flocculator, creation of a settlement zone and renewal of the partition between the preliminary and main reservoir.
One additional benefit of this project is that the new screen will also contain a channel from the preliminary reservoir to the main reservoir. That will save a lot of effort in sampling the water and during the annual maintenance. Because less silt and organic material now ends up in the main reservoir, the aeration cushions (which counter stratification) remain clean longer and can do their work better.

Long term

There is a lot of enthusiasm about the research. The process-based approach and the harmonisation between the various disciplines, biology, drinking water treatment, geohydrology and finance have led to a robust solution. If nothing is done, problems will indisputably arise with the groundwater level. A thick layer of phosphorus-containing silt will also build up at the bottom of the reservoir over the coming decades. When all improvements are implemented, the pre-treatment will mean that the banks will need cleaning less often and there will be less disposal of silt and organic materials. That results in a cost saving, and in the prevention of lowering of the groundwater table.

Jan-Dik Verdel
(Royal HaskoningDHV)
Ron Stroet
(Royal HaskoningDHV)
Henny Moonen
(WML)
Peter van Diepenbeek
(WML)
Pierre Engels
(WML)

Background picture: Main visual - Aerial photo of De Lange Vlieter (photo WML)

Summary

WML’s drinking water production -uses both surface water (by bank filtration) and groundwater. Inspection revealed that the compartmentalisation screen of the De Lange Vlieter reservoir, which is filled with water from the river Meuse, needs to be replaced. WML also expects the infiltration banks to get clogged more rapidly due to the rapid growth in the number of Quagga mussels. The clogging reduces the infiltration, which means that (if the extraction rate remained same) more groundwater will be used. This is an undesirable situation. Hydrobiological research has shown that constant loading with nutrients and suspended solids in the water from the river Meusehas led to a substantial production of biomass and strong development of the Quagga mussels in the reservoir. Artificial settlement of suspended solidsand binding of orthophosphate in the preliminary reservoir leads to substantial reduction in suspended solidsand less favourable conditions for the Quagga mussel in the main reservoir. The expectation is that the banks will require cleaning less often as a result.

^ Back to start
QUAGGA MUSSEL

Pre-treatment helps

Knowledge journal / Edition 1 / 2017

Is ammonia a problem in the surface water?

Water Framework Directive reports indicate that the standards for ammonia in bodies of water are frequently exceeded. The question is how seriously these exceedances should be taken with regard to the effect on the ecological condition of water and possible measures.

The first step in answering this question is a closer analysis of the measurement results from five water managers. The subsequent consideration relates to the causes and the effects.
Ammonium is included in the Water Quality Requirements and Monitoring Order 2009 (Besluit kwaliteitseisen en monitoring water 2009 - Bkmw). In practice the water managers measure the combined amount of ammonium (NH4+) and gaseous ammonia (NH3). The standard is based on a recommendation from the International Commission for the Protection of the Rhine (2009):
- For the annual average (AAV): 0.0041 mg NH3-N/l;
- For the maximum (MAC) value: 0.0082 mg NH3-N/l.
When tested using Aquo-kit (Informatiehuis water) the standard value for ammonium is calculated using these ammonia values on the basis of temperature and pH. For further analysis it is more useful to calculate the free ammonia on the basis of the NH4 measurement, temperature and pH, and to compare the outcome with the ammonia contents specified above rather than just assessing whether or not it complies.

Current position

The most recent report on the ecological condition of the WFD bodies of water relates to the years 2012-2013-2014. In the second River Basin Management Plan (2016-2021) ammonia has the most exceedances; the extent varies according to the river basin and the water manager (figure 1). At most water managers exceedances are reported in the ‘factsheets’, but it is possible that ammonium is not sampled at all bodies of water in the monitoring programme and has therefore not been measured.

Figure 1 - The extent of the exceedance of the ammonia standards in the water bodies in the WFD river basins and at five water managers (WFD factsheets December 2012). The results are based on measurement of MAC and AAV in period 2012-2014.

Nature of the exceedance

The further analysis has taken into account the results from the water managers’ entire measuring network. At the district water boards the results of the WFD test produce a more negative picture compared to the individual measurements or measuring points on the water managers’ entire measuring network (Figure 2). The exceedance of the MAC value is greater than the exceedance of the AAV. The percentages can easily differ by 10% from year to year.

Figure 2 - The size of the exceedance in 2015 expressed as the percentage of MAC exceedances out of all measurements, the percentage of measuring points (MP) with a MAC exceedance, the percentage of AAV exceedances across the entire measuring network and the percentage of the WFD bodies with an exceedance of MAC and/or AAV (report for 2012-2014).

Duration of exceedance

The impact of the duration of the exceedance helps to determine the toxic effect, but this is difficult to establish because it is customary to carry out random sampling of the water quality on a monthly basis. At all managers more than 60% of exceedances are occasional. 10 to 20% of the exceedances last two months.

Relationship between NH3 and NH4, temperature and pH

There is theoretically a link between ammonium, temperature, pH and ammonia. Plotting the ammonia concentrations at the five water managers against the other parameters allows points of correspondence and difference to be identified. It can be concluded from this that not one of the three factors is always determinant for a exceedance in the field. For example, it was found that exceedances also occur at low ammonium concentrations.

Characteristics of the surface water

The district water boards have carried out a more detailed analysis of the exceedances. Aa en Maas district water board concludes that the most exceedances occur at locations which are affected by discharges from sewage treatment plants. The exceedances there are greater than those areas with primarily agriculture and nature.
Rijland differentiates between polder and storage basin (‘boezem’), and then by usage function and soil type. The exceedances are slightly greater in the storage basin than in the polder. Built-up area and sandy soil score poorly amongst the polder bodies of water.
Wetterskip Fryslân had 49 exceedances of the MAC value in 2016; these exceedances particular occur in waters where the influence is not characteristic of the nature, agriculture and built-up area functions. At Hunze en Aa’s district water board, measuring points with a direct influence from a sewage treatment plant show relatively more exceedances at the measuring points without a direct influence, measured over multiple years. However, the difference is less convincing in an individual year.
The experience of many water managers is that it is not straightforward to establish a link between water quality at a particular measuring point and the local environmental conditions.

Further analysis: Sources of N load

It is important to have insight into the sources, particularly for the purpose of identifying potential measures. Based on the calculations of the Emission Registration (ER) agriculture, sewage treatment plants and deposition can be identified as the largest sources of total N. However, the ER does not (yet) include a separate calculation of the loading of surface water with ammonium. An indicative calculation of the loading of the storage basin leads Rijnland to conclude that sewage treatment plants, intake, polder water and deposition are the most important sources.

However, in order to determine the contribution to the ammonium load it is relevant in what form N is deposited in the surface water. It can be concluded from the reports concerning sewage treatment plants, the national measuring network for effects of fertiliser policy (LMM) and the National Air Quality measuring network that the proportion of NH4 within total N varies considerably across place and time. The variation in the forms of N is also shown in the comparison of measurements by Wetterskip Fryslân in effluent, a peatland ditch, a peatland channel and Sneekermeer lake. It is therefore not justifiable to draw conclusions on the basis of emissions and levels of total N.

Effects on ecology

The ecological condition of surface water is affected by many factors, and cannot be simply related to the ammonia exceedances. The mortality of soil organisms and young fish as a result of ammonia is hard to demonstrate in the field. The role of ammonium/ammonia also differs amongst plants and animals. A study by Rijn en IJssel and Vallei and Veluwe district water boards suggests ammonia plays an influential role in water plants. De Dommel district water board established a link between the height and duration of ammonia peaks and the macro fauna. Their assessment framework for emissions from overflow channels is based on this. The reasoning underlying this framework and the experience with it might be used for a possible reassessment of the standards to be set for surface water.
The toxic load from ammonium/ammonia occurs most frequently in the reports from STOWA about the development of the ecological key factor of Toxicity compared to the priority and specific polluting substances. To ensure confidence in the standard, it is important that the actual share of ammonia in the toxic load can be demonstrated in bio-assays, for example.

Measures

The available data about ammonia exceedances, about environmental conditions and about the loading of the surface water does not lead to a unequivocal conclusion with regard to the possible measures. The measuring results show that exceedances still take place at low ammonium concentrations (< 1 mg NH4-N/l). Such low concentrations would require a substantial reduction in emissions. It will be clear that a raised water temperature (as a result of climate change) and a raised pH (as a result of algae growth, amongst other things) will have an unfavourable influence on this problem.

Next steps

Based on the analysis of the measurement data and analyses by the water managers themselves, it is not yet possible to conclude how the problem can be resolved before the end of the WFD (2027). The next steps will therefore need to focus on a more detailed (local?) analysis of exceedances, ecological effects, standards and sources.

Roelof Veeningen
(formerly employed at Wetterskip Fryslân)

With thanks to Wim van der Hulst of Aa en Maas district water board, Harm Gerrits of Rijnland Polder Authority, Evert van der Laan of Hunze en Aa’s district water board and Marcel van den Berg of Rijkswaterstaat for their assistance with this article.

Summary

The WFD reports show substantial exceedances of the standards for ammonia. These are often exceedances that do not last longer than one month. There is not a single factor out of the determining factors (ammonium, temperature and pH) that dominates. Nor is it easy to establish a link between the extent of the exceedances and the conditions at the measuring points (water type, use and load). A quantitative relationship with the load is complex because of the different forms of nitrogen at the major sources (sewage treatment plants, agriculture and deposition) and because of the biological and chemical processes in surface water. The effects of ammonia on the ecological condition are hard to differentiate from other factors in the field.

In view of the possible consequences of the problem, it is recommended that the status of the standard be reconsidered, not only with regard to concentrations and duration of the exceedance, but also for the contribution to the toxic load in determining the ecological key factor of toxicity.


Sources consulted


International Commission for the Protection of the Rhine (ICPR), 2009. Derivation of environmental quality standards for Rhine-relevant substances. ICPR report no. 164.

Van Zuilichem, H and W. van der Hulst, 2015. Aa en Maas district water board. Memo Survey of ammonium problem amongst water managers in the Netherlands.

De Dommel district water board, 2015. An ecological testing instrument for assessing the effect of peak load from sewage water treatment and sewer overflows on the De Dommel river.

Rijnland Polder Authority, 2014. Ammonium in the Rijnland surface water: Survey of the problem.

Keijzers, R. and J.Postma, 2016. Toxic load and trends over the years 2007-2015 at Hunze en Aa’s district water board.

STOWA, 2016. L. Posthuma, D. de Zwart, R. Keijzers and Jaap Postma. Ecological key factor Toxicity part 2. Calibration: toxic load and ecological effects on macro fauna. STOWA report 2016 15 B.

^ Back to start

AMMONIA

How serious are exceedances?

Knowledge journal / Edition 1 / 2017

Citizen science project shows the value of citizens as scientists

The ‘Freshness of Water’ project is the first citizen science study in the Dutch drinking water sector. Research was conducted with citizen scientists in Amsterdam into the ‘freshness’ of their own drinking water, particularly the bacterial composition.

In recent years citizens have increasingly been involved in gathering and co-creating knowledge and innovation: citizen science. However, if you look at the Dutch drinking water companies we see that they are still making little or no use of the talents, ideas and manpower of customers and citizens. In order to gain greater insight into the possibilities and value of citizen science in the drinking water sector, KWR Watercycle Research Institute worked with Waternet to set up a practical citizen science experiment which is unique for the Netherlands: Freshness of Water.

Freshness of Water

The ‘Freshness of Water’ pilot project brought together various social science and natural science questions for examination. Hence the pilot was designed to answer both questions such as “What is the participants’ background and ambition” and “What significance do citizen scientists attach to their involvement” and to questions like “How does the bacterial composition of drinking water change during transportation and after stagnation?” and “To what extent does the bacterial population of drinking water produced in the west of Amsterdam differ from drinking water produced in the east of the city?”. In the study, citizen scientists took water samples at their home and performed analyses themselves. Samples were also transported to the KWR laboratory where the latest DNA techniques in the field of ‘Next Generation Sequencing’ were performed, making it possible to classify millions of bacteria at the DNA level. The engagement of the citizen scientists involved was also essential in this part of the research because they supplied samples from their tap water immediately after getting up in the morning, a type of sample that is impossible or very difficult for regular samplers to collect. The (interim) results were shared with the citizen scientists involved and evaluated together.

85 registrations

A prerequisite for every successful citizen science project is citizens who are willing to volunteer. In Amsterdam we launched the first citizen science project in the Dutch drinking water sector. An announcement with the option to link through to a specially created Facebook page about the background to the project resulted in 85 complete registrations. This was far more than the maximum 50 volunteers we were looking for.
Analysis of the registration show the majority of the Amsterdammers who wanted to participate as citizen scientists (i) are female (66%), (ii) were aged between 25 and 34 (32%), (iii) had a degree (47%) and (iv) had not previously participated in a scientific study (62%). However, those registering included people from all age categories and from various educational backgrounds. For 35% making a contribution to innovative scientific research was the most important motivation for participating, 26% had a special interest in drinking water, and 21% thought it would be fun to sample and carry out measurements themselves.
Important for the natural science component of the research was also the fact that the participants should have a geographical spread across the city of Amsterdam, so that drinking water originating from the two Amsterdam drinking water production locations (Leiduin and Weesperkarspel) and the mixed zone could be measured. The geographical spread was determinant in the final selection of participants (Figure 1). Only then was demographic variety considered, whereby account was taken of the male/female ratio, age distribution and educational background. Of the 50 Amsterdammers selected, 43 participants confirmed their participation.

Figure 1 - Participating citizen scientists at postal code level

Amsterdammers become citizen scientists

In order to introduce the selected participants to the background and objectives, the project started with a kick-off meeting at Museum Micropia. Subsequently all citizen scientists took water samples at home: two from the kitchen tap, of which one after 1 night of stagnation and one after 5 minutes of running water. Finally the citizen scientists added one sample of their own choice to the experiment, whereby choices were often made for somewhat ‘older’ drinking water from a glass, water bottle, coffeemaker or kettle.
The citizens scientists carried out two water analyses using a test strip. After 3, 5 and 7 days respectively of incubating at room temperature the participants counted the number of ‘dots’ i.e. microbe colonies on the strips. All participants carried out their home tests and share the results. All the samples were also analysed at the KWR laboratory. The laboratory analyses showed that sampling had been carried out carefully by all citizen scientists.

Water is a fresh product

The analysis results for the cultured bacteria show that the drinking water from the tap contains virtually no cultivable micro-organisms. In contrast, drinking water that has been stored in a bottle, glass or water bottle contained many cultivable bacteria, due to bacterial growth. Alongside the citizen scientists’ home analyses, all samples were analysed for the total microbial biomass (ATP) and the total number of bacteria at the KWR laboratory. These analyses showed the same trends as for the cultivable bacteria, with the difference that the number of cultivable bacteria make up only a small fraction of the total number of bacteria in drinking water (<0.1%). This means that most bacteria in drinking water cannot be cultured on the tested culture medium.
In addition, the bacterial composition of the various water samples was determined using ‘Next Generation Sequencing’. This analysis shows that the total number of bacteria species in all Amsterdam drinking water samples from the kitchen tap (immediately and after flushing) was higher than 51,000. This high diversity is larger than has been observed in drinking water of other countries. The reason for this is that outside the Netherlands drinking water is often chlorinated, as a result of which many bacterial species are unable to survive. We expect that the high species diversity improves water quality, because these natural residing bacteria prevent establishment of unwanted micro-organisms in the drinking water environment.
Follow-up research should give a definitive answer to this hypothesis. Another finding is that an important proportion (30-50%) of the bacteria are still unidentified. The bacterial composition of drinking water was found to remain virtually unchanged during the transportation of drinking water to the customer, but the bacterial composition does change at night during stagnation in the home drinking water system, albeit to a small extent. In contrast, when drinking water is stored in a bottle, the bacterial composition changes dramatically, which can be seen in Figure 2.

Figure 2 - Example of the bacterial community composition at Order level, measured from the treated water at the production location and at one address in the distribution system. From left to right: treated water production location, drinking water after one night standstill in the premise plumbing system (direct), after 5 min flushing and the same water stored in a plastic bottle.

The bacterial composition of drinking water that is produced in the east of the city differed from the drinking water that is produced in the west of the city (data not shown). This confirmed earlier observations in other supply areas in the Netherlands and abroad. Apparently every production location produces drinking water with its own specific bacterial flora.

Openness and transparency

One important element of the citizen science pilot project consisted of an open interaction with the citizen scientists and transparent feedback of results. This transparency was also new and unfamiliar for the water company and the professional scientists, particularly since it was not known in advance how the results would turn out. Following the start-up meeting, this interaction mainly took place on the “closed” Facebook project page and an interactive GIS map on which all the participants involved shared research results, questions and comments throughout the project. Just under five months after the start, the final results were shared with a wide audience at a public meeting at the debate centre Pakhuis De Zwijger.

The value of citizen science

An evaluation (79% response rate) following the pilot project showed that the citizen scientists felt that their participation was educational (94% and fun (88%). They also indicated that their knowledge and awareness of drinking water was enhanced (91%). The participants indicated far less often that their participation in the experiment led them to modify their drinking water behaviour, such as replacing or running water more often. However, it is interesting that confidence in the quality of drinking water and the water company increased at 65% and 59% respectively of the participants.
A reflective focus group also showed that confidence had increased. Participants indicated that by participating they not only came to see how advanced Waternet's tap water production is, but particularly that they perceive the transparency, including about complicated issues such as microbes, as a particularly confidence-inducing element. Virtually all the citizen scientists involved (97%) indicated that they would certainly consider participating in another citizen science project related to drinking water in the future. A majority of the Amsterdammers involved also indicated that they were open to be involved in issues relating to drinking water in other ways.

Conclusion: There's more to fresh water!

Thanks to the efforts of the citizen scientists involved, we can conclude that the bacterial composition of a fresh product like drinking water changes when it’s transported or stored. At least as important is that we can conclude that involving citizens in research in the water sector works and offers benefits. With the appropriate support they can make a valuable contribution to scientific research. It also makes the citizens involved more conscious, improves confidence in drinking water, and offers office professionals a fun, new and valuable perspective. Based on this experience, Waternet has now started a new citizen science project, KWR Watercycle Research is investing with increasing intensity in research in the area of customer interaction and citizen science, and at least three other drinking water companies are launching research projects in 2017 in which citizens as researcher play a central role.

Stijn Brouwer
(KWR Watercycle Research Institute)
Paul van der Wielen
(KWR Watercycle Research Institute)
Merijn Schriks
(KWR Watercycle Research Institute)
Maarten Claassen
(Waternet)
Leon Kors
(Waternet)

Co-authors: Ellen Schaasberg, Annina van Roode, Arnoud Schouten, Arnoud ten Haaft, Astrid Paulus, Bas Mijling, Bettine Lalieu, Cheyenne Oorebeek, Dia Huizinga, Dionne Pierik, Emiel van der Plas, Eric Krediet, Fleur Prinsen, Frans Peters, Freek Groot, Hugo Lingeman, Hylke Hoekstra, Isabelle Beverwijk , Jacobijn Zeijlemaker, Jean-Marc de Waart, Jouke Rozema , Linda Verstraten, Lisette Scholtus, Margriet Metz, Marije Bouterse, Marijke Blankman, Marijke Dinnissen, Marit Olsthoorn, Marjon Rosinga, Marjorie Bakker, Martijn Wismeijer, Martin Boeckhout, Michiel van der Ros, Monique Link, Peter Dohmen, Sarah Arayess, Sofija Fokeeva, Sophie Raterman, Talita Haasnoot, Tessa Esteban Lopez, Tom Niekamp , Wiebe Sloot, Wieteke Hiemstra (citizen scientists)

Summary

The ‘Freshness of Water’ project is the first citizen science study in the Dutch drinking water sector. In conjunction with KWR Watercycle Research Institute and Waternet, citizen scientists in Amsterdam carried out research into the ‘freshness’ of their own drinking water, whereby the bacterial composition was examined in more detail. The researchers demonstrated that bacterial populations change upon storage of drinking water in a bottle, concluding that drinking water is a fresh product. Insight was also obtained into the social scientific value and significance of citizen science. This study shows that citizen scientists were found to be reliable in sampling and measuring.

^ Back to start
CITIZEN SCIENCE

First time in water sector

Knowledge journal / Edition 1 / 2017

The dynamic interaction between rivers and riparian vegetation

Insight into the interaction between water, sand and vegetation in rivers is required in order to achieve a good balance between safety at high water, navigability and nature. These dynamic interactions can be simulated with a specially developed model on a timescale ranging from decades to centuries.

In a natural river floodplain, riparian vegetation is regularly flooded. Certain types of vegetation, called ‘eco-engineers’, can actively influence the water movement and the erosion and deposition of sand. For example, willows and poplars strengthen the soil with their roots and can survive periodic flooding. They also offer resistance to the flow, resulting in a decreased flow velocity in vegetated areas and a slight increase in water level.
Sand and silt is then deposited in these vegetated areas during high water, which allows the new establishment of plants. On the other hand, part of the water is routed past bare parts, resulting in faster flowing water and sand being washed away. Hence, eco-engineers influence the location where sand is deposited and washed away, mainly during high water. This interaction between water, sand and vegetation leads to characteristic patterns in terms of river shape and vegetation. These patterns in turn are important for a diverse ecosystem.
There is currently still little insight into how these dynamic interactions work, whilst this is required in order to find a good balance between safety at high water, navigability and nature. It is therefore important to know what the effects of various types of vegetation are on the movement of water and sand in the river, and how the river pattern and the vegetation pattern change over the long term.

Research into vegetation and rivers

There are various ways of studying how eco-engineers influence the shape of a river. Field data, aerial photographs and elevation scans show clearly where and what type of vegetation can be found relative to the water level and how this changes over time. Another approach is flume experiments, in which a river with vegetation can be simulated at a smaller scale. It is possible to examine how river patterns develop by varying water flows and combining them with various types of vegetation and vegetation patterns. Such experiments can provide insight into how seeds are transported and deposited by the flow and thus form a natural vegetation pattern. As a result, we know that vegetation has an important influence on the shape of rivers. For example, our experiments have shown that the addition of vegetation changes a braiding river into a meandering river.
Unfortunately, there is often too little data to predict the development of an entire river landscape over the longer term ranging from decades to centuries. That is why we have constructed a computer model that not only incorporates the effect of flow and sand transport due to vegetation, but also the natural development and mortality of riparian vegetation. Up to now, either vegetation could not develop naturally in models or the processes of water and sand modelling were more primitive than they could potentially be. This combination makes it possible to simulate both river migration and the movement of meander bends as well as the associated natural vegetation growth. Water and sand are calculated using the extensively tested software package Delft3D-Flow. The module for riparian vegetation calculates where plants can establish, how they grow and when they die as a result of too much water-induced stress (figure 1).

Figure 1 - Flow diagram of the model.

The vegetation model in action

The model results were compared to the behaviour of the Allier River, the last freely meandering river in Western Europe, for which field data and aerial photographs are available. The results show that the model can reproduce the natural vegetation and river patterns and dynamics well (figure 2). Relationships between the characteristics of vegetation and the movement of water and sand as we know them from the field thereby occur of their own accord. For example, denser vegetation reduces the movement of sand in the higher parts of the river floodplains, and the river pattern changes from migrating meanders to shifting channels when vegetation is denser and stronger.

Figure 2. Patterns of the natural Allier river in France compared with the model.
Top: comparison of river pattern.
Bottom: comparison of vegetation patterns. Old vegetation is usually further from the river, and young vegetation is closer to the river.


River landscapes are sensitive to the advance of exotic invasive species which did not previously occur here. This is because water is a good way for propagules (seeds and parts of the plant which can grow into new plants) of invasive species to spread rapidly. Invasive plants can not only displace the existing vegetation and disrupt the ecosystem, but often also have characteristics which influence the shape and behaviour of the river.

Invasion

With our model we simulated an invasion by a perennial herbaceous riparian plant like Japanese knotweed (Fallopia japonica), which competes with willows and poplars. The results show that an invasion with many propagules strongly reduces the amount of natural riparian vegetation. Surprisingly enough, more natural riparian vegetation actually occurs if the invasion takes place with far fewer propagules, leaving more space for the natural vegetation. This is because the invasive plant creates more suitable settlement locations for young willows and poplars due to their eco-engineering capabilities that are comparable to native vegetation.
However, invasive plants often have other negative characteristics, such as the excretion of toxic substances that retard the growth of natural vegetation and can therefore partly outbalance the positive effect.
The modelled invasive plant has a different life strategy from the willows and poplars, as a result of which the movement of water and sand also develops differently in each season. The aboveground part of the invasive plant dies back in winter, just when high waters occur. This leads to larger transport rates of sand across the inner bends, leading to erosion of the banks.
The opposite occurs in summer when the invasive plant forms a dense cover, as a result of which water levels can rise substantially. This can lead to flooding in the summer and autumn. This modelling of vegetation characteristics and life strategy therefore provides a prediction of unexpected effects in different seasons.

Dams and climate change

In many rivers, the natural processes of river flow and river migration is restricted by humans. Dams that have been constructed for flood protection, navigation and irrigation cause a substantial reduced variation in water levels throughout the year, which disrupts natural ecological processes. Climate change also has an impact on the river flow: climate models predict a general trend towards reduced river flow on average and more extreme low and high waters for north-west Europe.
Model results show that the effects of dams are acute, and the effects of climate change are gradual. Both lead to differences from the natural situation, as a result of which some fish species, riparian plants and water plants benefit, whilst other species decline. The effect on the ecosystem is greatest when the timing between important processes for plants and animals which are linked to the peaks and troughs of the water level are disrupted. Negative effects of a dam and a climate change scenario can sometimes reinforce one another and sometimes weaken one another. The most negative effects occur in a climate with more extremes of high and low water combined with a dam which stores water in winter and releases water in summer for irrigation. It is also possible to diminish the negative effects of climate change with a different dam regime, which offers opportunities for more sustainable management.

Translation to practice

The model used here provides insight into the interaction of vegetation and river behaviour. The model has been constructed in such a way that it can be relatively easy linked in the future to an existing Delft3D model. This enables the prediction of effects of - for example - invasive species, dams and climate change and helps in finding ways to mitigate these effects. This model makes it possible to allow the hydraulic resistance of natural vegetation to vary over time, so that it can be used to calculate the long-term effects of management measures on the riparian vegetation and related water levels. Steps are currently being taken to implement the vegetation module in the Delft3D software. Once this has been done, a wider user base can use this innovative method for dynamic vegetation modelling.

Mijke van Oorschot
(Deltares, Utrecht University)
Maarten Kleinhans
(Utrecht University)

Summary

There is currently little insight into the way in which water, sand transport and vegetation affect one another and hence determine the shape of the river and the vegetation pattern. This is required if the long-term effects of human interventions on the development of nature and water levels needs to be determined. That is why we have developed a model that can simulate these dynamic interactions on a timescale ranging from decades to centuries. A comparison with data from the field shows that the model can reproduce natural vegetation and river patterns and dynamics successfully. The model has been used for research into the effects of invasive species, dams and climate change, but can also be used in future to calculate the effects of ecological restoration measures.

^ Back to start
RIPARIAN VEGETATION

Simulated interaction

Archive


Edition 1/2015


Edition 2/2015


Edition 1/2016


Edition 2/2016

ARCHIVE

Previous editions

Knowledge journal / Edition 1 / 2017

ABOUT WATER MATTERS

The knowledge section Water Matters of H2O is an initiative of


Royal Dutch Waternetwerk
Independent knowledge networking organisation for and by Dutch water professionals.


Water Matters is supported by

ARCADIS
Global natural and built asset design and consultancy firm working to deliver sustainable outcomes through the application of design, consultancy, engineering, project and management services.


Deltares
Independent institute for applied research in the field of water, subsurface and infrastructure. Throughout the world, we work on smart solutions, innovations and applications for people, environment and society.


KWR Watercycle Research Institute
Institute that assists society in optimally organising and using the water cycle by creating knowledge through research; building bridges between science, business and society; promoting societal innovation by applying knowledge.


Royal HaskoningDHV
Independent international engineering and project management consultancy that contributes to a sustainable environment in cooperation with clients and partners.


Foundation for Applied Water Research (STOWA)
Knowledge centre of the regional water managers (mostly the Water Boards) in the Netherlands. Its mission is to develop, collect, distribute and implement applied knowledge, which the water managers need in order to adequately carry out the tasks that their work supports.


Netherlands Water Partnership
United Dutch Water Expertise. A network of 200 Dutch Water Organisations (public and private). One stop shop for water solutions, from watertechnology to coastal engineering, from sensor technology to integrated water solutions for urban deltas.


Wageningen University Research
Research institute that contributes by qualified and independent research to the realisation of a high quality and sustainable green living environment.

ABOUT WATER MATTERS