CONTENTS

Knowledge journal / Edition 2 / 2016

PREFACE

Water Matters: once again, a wide range of subjects

This is the fourth edition of Water Matters, the H2O knowledge magazine. This time with nine interesting articles, introducing you to new applicable knowledge in the water sector. These articles are written by Dutch water professionals.

The Editorial Board once again made a strict but fair selection from the many proposals that were submitted. As before, we concentrated mostly on two criteria: Is the knowledge presented here really new and is there a clear relationship with daily practice? In other words: Can this be applied now, or in the foreseeable future? It is nice to notice that we can once again present a wide range of topics.

Water Matters, just like the monthly magazine H2O, is an initiative of Royal Dutch Waternetwerk Water Network (KNW), the independent knowledge network for and by Dutch water professionals. The publication of Water Matters is made possible by leading participants in the Dutch Water Sector. The Founding Partners are ARCADIS, Deltares, KWR Watercycle Research Institute, Royal HaskoningDHV, the Foundation for Applied Water Management Research (STOWA) and Wageningen Environmental Research (Alterra). With Water Matters, they want to make new, applicable water knowledge accessible.

The Netherlands Water Partnership (NWP), the network of approximately 200 cooperating (public and private) organizations in the field of water, makes the English edition possible.
For you as water professionals, it's good to know you can share articles from this digital magazine quite easily with your international contacts. Articles from previous editions of Water Matters are also easy to find. We can also be followed via Twitter: @WaterMatters1.
We hope you enjoy this edition.

Monique Bekkenutte Publisher (Koninklijk Nederlands Waternetwerk)
Huib de Vriend Chairman Water Matters Editorial Board

PREFACE

Knowledge journal / Edition 2 / 2016

Dynamic coastal management in the Netherlands

Drifting sands benefit coastal safety and nature

For the last 25 years, many dunes along beaches have been managed 'dynamically': drifting of sand is permitted or even encouraged. Where managers of dikes and dunes used to have their own 'fiefdoms', they now work together. Researchers follow the developments closely. They all agree: dynamic coastal management has proven itself. Coastal safety and (the quality of) nature both benefit from this cooperation.

Dynamic coastal management can be described as managing parts of outer or frontal dunes in such a way as to allow room for the drifting of sand. What this management looks like in practice differs from place to place. In many places, the coastal managers refrain from planting marram grass, which means that the wind can pick up the sand. In other, selected places, excavators stimulate the drifting of sand by removing vegetation and the top layer of the sand.
The possibilities for dynamic coastal management have markedly increased due to the coastal policy that came into effect in 1995. Since then, the coastline in many places along the Netherlands’ coastline is held in place by nourishing sand along the coast. This 'nourishment ' of sand on the beach and in the shallow sea, (temporarily) compensates for the structural removal of sand in the coastal zone. Especially in places where the dunes are wide, it is no longer necessary to maintain a high, thickly planted marram-clad frontal dune for the sake of safety. The nourishments ensure there is sufficient sand in the coastal system even if sand is shifting into the dunes.

Safety benefits

Due to dynamic management, smaller and larger blowouts are formed in the frontal dune. These blowouts act like a conveyor belt for sand: the wind transports the sand from the beach via the blowouts into the dunes at the back. There, the sand accumulates, so the dunes can grow with the rising sea levels. In this way, there are long-term benefits for coastal safety.

Examples of blowouts may be found in the Noordhollands Duinreservaat (North Holland Dune Reserve), between Wijk aan zee and Castricum aan zee. Here, the wind has sculpted a natural gap in the frontal dune, named the 'Gat van Heemskerk'. Following the sand nourishments of 2005/2006 and 2011, huge volumes of sand shifted through this blowout, from the beach into the dunes, which was then deposited in a semi-circular parabolic dune landward from the blowout. In 2016, sand had been blown over the parabolic dune forming an almost 130 metre long sandy tongue at the back of the frontal dune.

Another example is the 'Wezel', a smaller blowout that originated in the frontal dune west of Heemskerk, and extended in the direction of the beach. As soon as the blow-out linked up with the beach, the wind started moving sand towards the dunes. The sand now accumulates to form a new frontal dune.

And nature benefits as well

The drifting sand is the 'engine' in the development of a more natural coastal dune landscape. Straight, frontal dunes looking like sand dikes are being converted into dynamic, more natural dunes with ‘smoking’ peaks and valleys. Dense, ‘old’ brushwood thickets are being buried under moving sands, making way for bare sand and pioneer vegetation. As a result, diversity in habitats, flora and fauna increases. In order to survive, some European protected habitats, such as embryonic dunes, white dunes and grey dunes, depend on (some) drifting sand from the beach and frontal dune.

Spectacular examples of the effect of implementing the dynamic approach can be found on Terschelling, among others in its central coastal zone (km 15-20). The Department of Public Works started a sand drift project along this 5 km long stretch of the frontal dune in 1995. The objective was to transform the frontal dune, which was high and straight, into a dynamic landscape and at the same time to increase the natural value of the dune habitats. Trenches were dug and sand screens were positioned that were to 'steer' sand as much as possible inland.
The measures quickly had the intended effect: a drifting sand dune area emerged, unique to the Netherlands. A freshwater lens seeping water at the edges meant that rare plant species such as Marsh Helleborine and Adder's-tongue Fern could establish themselves. Dry dune vegetation sprung up on the thick sand cover.

Nitrogen deposition

Atmospheric nitrogen deposition in the dunes is a problem. The deposition may have been declining during the past few decades, but it is often still too high for nitrogen sensitive habitats such as dunes poor in lime.
The Programmatische Aanpak Stikstof (PAS-a national Dutch programme for mitigation of consequences of nitrogen deposition) was therefore started in 2009. The purpose of this programme is to reach Natura 2000 objectives while at the same time creating more space for new economic activities. Reaching Natura 2000 targets is done in two ways: reducing nitrogen supply and set out recovery strategies for threatened habitats. Dynamic coastal management constitutes one of these strategies.

Measures are being taken at the 'Kop van Schouwen', to create a dynamic situation with sand blowing from the beach far into the dunes. In that context, the scheduled nourishment is skipped for once and no repairs are done after storm damage. To stimulate the drifting of sand two artificial gaps are created. This is how the local nature management authority (Staatsbosbeheer) intends to restore the 'Grey dune' Natura 2000 protected habitat (the PAS program’s objective).

Revolution

The introduction of dynamic coastal management was a revolution in coastal management. Until 1990, coastal dune management authorities and inland dune managers had very little to do with each other. Each had their own management area, often separated by a fence. Dynamic coastal management brought a change to this: after all, wind-blown sand disregards administrative boundaries.

As the introduction of dynamic coastal management was slow to get started, Stichting Toegepast Onderzoek Waterbeheer (STOWA) and the Department of Public Works joined hands in 2010. They offered a helping hand, providing coastal management authorities, notably water boards with opportunities for dynamic coastal management. In addition, they organized (well-attended) yearly workshops on this subject since 2010, each time at different locations along the coast. Workshop participants discuss opportunities, problems, effects and experiences along with coastal safety managers, dune managers, researchers and policy makers. Visits to dynamically managed coastal areas are part of the programme where, besides safety, other issues like nature- and drinking management are at stake. The coastal management authorities are 'spreading the word’ and coastal landscapes are seen much more as a natural sand-sharing system.

Joint projects

Dike and dune managers work more and more together on the management of coastal dunes. In many places, they have discussed and agreed at which locations the sand may be helped to start shifting and how deep blowouts may become. Joint projects are conducted.
An example of this is found along the dynamic coast between Wijk aan Zee and Castricum. This is where the Kieftenvlak is located: an infiltration area producing a quarter of the volume of drinking water to North Holland’s population. As the area was located outside the sea defence and flooding by the sea would have disastrous consequences for the supply of drinking water, it had to be protected. The protection of the Natura 2000 habitat types in the area had to be considered as well.

The dike administrator (Hollands Noorderkwartier Water Board) and the dune management authority, at the same time drinking water company (PWN), agreed on measures that would be beneficial for coastal safety, nature and drinking water security.
In the winter of 2015/2016, two new dunes, for which sand was excavated from a nearby gap, were constructed to create a sea defence, which protects the Kieftenvlak against potential flooding. The prevailing southwesterly winds blow calcareous sand from the beach through the man-made gaps into the new sea defence. As a result, the first row of dunes is strengthened at the back, in this way increasing the safety of the infiltration area. Measurements by the Water Board have indicated dozens of cubic metres of sand already moved inland in 2016.
The drifting sand rich in lime also has a positive effect on the quality of dune grasslands and on the insects inhabiting these grasslands.

Communication

Although support for dynamic coastal management has grown enormously among policy makers and administrators, not everyone is happy with the new approach. On the Wadden Islands in particular, some residents fear for the safety of the island and object to the sometimes large quantities of drifting sand on roads and fields. Another issue is that many dune workers (marram planters) lost their jobs due to the fact that dynamic management no longer required the planting of marram grass, at a time when there was already little employment on the islands. With the introduction of the new management methods, residents were also given limited explanation on the implementation of the new coastal defence methods.

The importance of communication has been recognized increasingly over the last decade. This is a key point on the agenda during the dynamic coastal management workshops. Coastal management authorities go talking to residents and users far more than before. For example, on Vlieland and Terschelling, the Public Works Department regularly holds excursions for island residents to discuss local issues. Based on topographical relief map series, they can see how the area develops over time: there is more sand present in the coastal dune than before, meaning that the dunes behind dynamically managed coasts are often wider and safer. Residents also take active part in the dynamic coastal management projects, for example by placing sand screens at eroding and potentially threatening locations to capture sand. Among island residents this led to increased support for dynamic coastal management.

In conclusion

Moving sand using the force of nature has thus become the 'life-line' of the Netherlands’ sandy coastal system. No sand movement means a 'dead' system that is irrevocably doomed to lose more and more natural values. Dynamic coastal management shows that recovery of natural dune habitat values is possible and that the safety of the dunes is strengthened at the same time. Besides, many people appreciate the beauty of dynamic landscapes, which is good for coastal tourism.
For some people, a ‘sand smoking’ frontal dune full of blowouts requires getting used to: will the situation remain safe? Air-radar (LiDAR) monitoring data show that the dunes around the blowouts become higher and stronger. Communication of the monitoring results is therefore important.
The challenge in implementing dynamic coastal management is how to fit it into the existing coastal dune landscape littered with roads, cycling paths and buildings. Cooperation, knowledge sharing, carrying out pilots, sharing experiences and open communication with all stakeholders involved are essential. The ultimate goal is a strong, varied, natural and attractive coastline. A dynamic coastline is robust even if our climate changes.

Moniek Löffler
(Bureau Landwijzer)
Bert van der Valk
(Deltares)
Tycho Hoogstrate
(PWN)
Petra Goessen
(Hoogheemraadschap Hollands Noorderkwartier)

Summary

Many dunes have been managed 'dynamically' along beaches over the last 25 years: the drifting of sand is permitted or even encouraged. Where coastal management authorities of dikes and dunes used to have their own 'fiefdoms', they now work together. It is clear from numerous examples that both coastal safety as well as nature benefits from this form of management.

For people living on a dune coast, a ‘sand smoking’ frontal dune full of blowouts requires getting used to: will the situation really remain safe?

Elevation data has shown that the dunes around gaps only become higher and stronger. That this requires proper communication is increasingly recognized over the past decade.

^ Back to start
COASTAL MANAGEMENT

The benefits of drifting sand

Knowledge journal / Edition 2 / 2016

Robots inspecting drinking water pipes

Drinking water pipes should not be replaced before the end of their life. This would be a waste of resources. But neither should they be replaced late, because the possibly ensuing calamities may also be costly. What is the most accurate way to determine the remaining life of a pipe and which role can robots play to answer this question? KWR, Wetsus and the Dutch drinking water companies are building a prototype.

With some exceptions large-scale extensions of the Dutch drinking water networks are no longer being implemented. About two decades ago, a new phase, the phase of network maintenance, started. The new key question is how to keep these networks in a good condition at acceptable cost.
Many pipes are reaching the end of their lifespan and will have to be replaced in the coming decades. In order to do this efficiently, it is important to know the real condition of the pipes. In this way, only the pipes, which are actually close to failing, will be replaced.
Pipe material and age are not the only determining factors; other factors also affect the aging of pipes. Current technologies can provide the required information about pipe condition to some degree, but have limitations, which prevent a widespread application on a sufficiently large fraction of the network. A different approach, described in more detail here, is expected to provide a solution.

Challenges

The internal inspection of a drinking water pipe is quite different from inspecting an oil or gas pipeline, for which many techniques have been developed. The nature of the drinking water network is different because of its shape (meshing, bends, T-joints, valves, changes in diameter, access points), variability of flow (velocity and direction), positioning (one meter below the ground and right in the middle of both customers and other infrastructure) and the prime importance of hygiene and continuity of supply. The use of different materials in the network also means that a single sensor cannot be used for all pipe sections. Therefore, a universally applicable inspection tool needs to be equipped with multiple sensors.

Proposed solution

A concept has been developed within the project Ariel, which is collaboration between the Dutch drinking water companies, KWR Watercycle Research Institute and Wetsus. A prototype is currently being developed from this concept. The concept provides a solution for the challenges discussed above and specifically focuses on the special requirements posed by the application in drinking water. It is a system of autonomously operating robots (AIRs, autonomous inspection robots) which continuously reside within the drinking water network and which are equipped with multiple sensors for the determination of pipe condition and other parameters. The robots are self-propelled and can clamp inside a range of diameters. Throughout the network, pipe segments are equipped with facilities for inductive charging of the robots and data transfer (measurements and new instructions). The robots move and navigate autonomously through the network. Because of their autonomous operation, they can perform measurements 24 hours per day without requiring active control by an operator. This concept is illustrated in Figure 1.

Figure 1 - Vision of a system of autonomous robots that can move through the network (A), be inserted and extracted at specific locations for maintenance (B), be charged and transfer data at several locations in the network (C), and perform measurements everywhere they go (D).

Principles and design philosophy

The system that has been conceived is basically complex. However, rapid developments in the fields of microelectronics, actuators (components that can affect their surroundings, for example servo motors) and software of the past decades allow the use of many components 'off the shelf'. This is the main principle of the project: the reduction of complexity and the number of tasks in the development project by using as many tried and tested components as possible. For some specific components, this approach could not be followed. An example is discussed later on.
The focus of the development is on the robot as a carrier of sensors and initially not on the sensors themselves. This field shows rapid developments as well. Initially, the robot will be equipped with a newly developed ultrasonic sensor for the determination of the effective wall thickness in cementitious pipes and a sensor for the detection of defects in PVC pipes, currently under development. And of course a camera and positioning sensors.
However, the robot is designed in such a way that it is well prepared for several additional sensors which are expected to become available in the near future.

Design and construction

Several possible shapes can be conceived for the robot. However, not all shapes are equally suitable, e.g. because of carrying capacity for batteries, or the ability to move through T-joints or stably position itself with respect to the pipe wall. From a wide range of ideas, the one that best meets the demands and boundary conditions was selected (together with experts from the water companies): a segmented snake.

Figure 2 - Visual concepts have been produced for several design ideas in order to facilitate the discussion on the selection of a concept. The selected design is in the middle.

The segmented snake can actively bend between all segments in a single plane. This requires a significant number of actuators and control systems, but it results in stability, flexibility and interior space for all required functions. Because a chain of modules is used, components can easily be relocated in order to achieve optimal performance.

3D printing is ubiquitously applied in the construction of the prototype, because of the short production time and large freedom of design. It also facilitates the application of lightweight and waterproof materials. When necessary, the selected off the shelf components are modified for functioning in drinking water and under pressure.

Specific components

The selected design allows us to use many existing tried and tested mechanical and electronic components, in line with the design philosophy. An example of a component for which this proved impossible, is the rotation of the segments relative to each other. Existing solutions use a motor with a lubricated shaft penetrating the hull and keeping the inside dry under outside pressure. This is technologically achievable, but from a hygiene point of view, a solution without penetration of the hull or the use of lubricant is preferable. We have developed a solution, which uses a magnetic coupling to transfer rotations through a hull. Figure 4 shows its design and realization.

Current status

A large part of the first prototype of the inspection robot has been built and is being subjected to tests. This includes the hull, propulsion, and a clamping mechanism for centering and stabilizing the robot (for measurements and guidance through bends). Actuators between the modules allow the negotiation of bends. These are currently still actuated by remote control; autonomy is outside the scope of the current project. The modules have been built in such a way that they are interchangeable, allowing the selection of optimal combinations of modules. A camera mounted on the front module gives the user visual feedback.

Outlook

The tests currently being performed within the Ariel project (e.g. on energy consumption) render insights that will not only allow further refinement of the design but also give an indication on power requirements. Following from that information the number of required battery modules for a long-term stay in the network can be determined and this defines the length of the snake.

This shows a big step from the original idea to a wired prototype. However, eventually we want to have a completely functioning autonomous robot system. In order to achieve this, the Dutch drinking water companies have decided to set up a new, more substantial project, which aims to develop just this. This means that aspects such as autonomy, sensors and data storage for condition assessment, communications; energy transfer etcetera will also be addressed. Currently, this new project is being initiated, and it should lead to the desired system within a couple of years.

Perspective

The application of a robotic system in the drinking water network will lead to a giant leap in knowledge. Currently we think that we know the condition of some small parts of the network, but with this application we will actually know the condition of pipes in all parts of the network that can be visited. This means that the pipes can be replaced at the right moment, avoiding costs of early replacements, as well as costs of incidents resulting from late replacement (e.g. pipe bursts).
Additional results like knowing the exact location of leaks and a better localization of pipes further increase the actionable knowledge base for water companies. The main challenge for now is (to be worked on in parallel with the development of the robot system) to get ready for the huge amounts of data that will be available, both in terms of technology and in terms of organization, to allow an effective application and valorization of the data.

Peter van Thienen
(KWR Watercycle Research Institute)
Maurits Maks
(KWR Watercycle Research Institute, Wetsus)
Doekle Yntema
(Wetsus)

This project is collaboration between Wetsus, European Centre of Excellence for Sustainable Water Technology, in the framework of the Smart Water Grids theme, and KWR Watercycle Research Institute, in the framework of the joint research program of the Dutch drinking water companies (BTO). Participating parties of the Smart Water Grids theme are Vitens, PWN, Brabant Water, Oasen and Acquaint. Participants of the BTO are all Dutch drinking water companies and De Watergroep (Belgium).


Figure 3 - Current prototype of the inspection robot, with clamping modules (A), electronics modules (B), actuators for bending movements (C), a propulsion module with camera and lighting (D).

Figure 4 - Photograph of the inside of the waterproof actuator, containing a motor, gearing and a ring of magnets. Force and rotation are transferred onto the outer ring with magnets trough the watertight hull (under).


Summary

In order to carry out pipe replacements in the drinking water network in the coming decades in a cost effective manner, a better knowledge of the condition of these buried pipes is essential. Because current techniques can only meet this need to some degree, KWR and Wetsus collaborate with the drinking water companies on the development of an autonomous robotic system aimed to make this information available on a much larger scale.

^ Back to start
ROBOTS

Inspecting drinking water pipes

Knowledge journal / Edition 2 / 2016

Nereda technology shows a steep growth curve

It was a revolution from the start: aerobic bacteria packaged in granules, purifying waste water. The first pilot installation was constructed in Epe thirteen years ago, and 30 have since been realized, or are in the pipeline, worldwide. The water authorities responsible for the five municipal Dutch Nereda® plants used to purify municipal waste water are working together on optimizing this technology. The results are visible.

The innovative Nereda® technology was developed by the Dutch water sector in a unique collaboration between seven water authorities, the Foundation for Applied Water Research (STOWA), TU Delft and Royal HaskoningDHV.
This technology is based on aerobic granular sludge. With Nereda, contemporary effluent requirements can be met at a low investment and operating costs. In addition, the use of energy, raw materials and space is significantly less compared to the conventional activated sludge system. In contrast with the activated sludge system, the Nereda system is a batch process, where the different processes do not take place in separate tanks, but all in a single reactor. The feeding stage and the effluent discharge take place simultaneously and are followed by a biological phase and a settling phase.

The Nereda technology was successfully launched in a relatively short time, from a first pilot plant in Epe in 2003, to a broad practical application. In addition to numerous pilot plants in the Netherlands, the construction of the first industrial installation that followed in 2005 and two demonstration plants in Portugal and South Africa played an important role.
The world's first full-scale municipal plant was put into operation in 2011 in Epe, and the plants in Dinxperlo, Garmerwolde, Vroomshoop and a demonstration plant in Utrecht followed two years later.

This more or less simultaneous start-up was also the launch of SOON (Dutch acronym for the Cooperation in Startup and Optimization of the Nereda plants), in which technical and operational knowledge and experience are exchanged in order to optimize the technology together. Important steps could be taken towards linking application-oriented research with practical experience.
The latest STOWA report on Nereda technology appeared in 2016 and described the technological development, from pilot to practice. A small but interesting selection of the results is presented in this article and translated into Dutch and foreign practice.

Nereda plants

At the time of the SOON project, there were five municipal Nereda plants operational in the Netherlands. Sand filtration was used in the first plants in Epe and Dinxperlo– because of the strict phosphate requirements (0.3 and 0.5 milligrams Ptotal per liter). This post-treatment wasn't necessary in later designs. The plants in Epe and Dinxperlo were designed with three Nereda® reactors to convert the technology’s batch character to a continuous waste water treatment.
In Garmerwolde, the number of reactors required was reduced to just two with the use of an influent buffer. The hybrid implementation, where, in dry weather, 50 percent of the waste water is treated in the Nereda plant and the other half in a conventional activated sludge plant, is characteristic of the Vroomshoop installation. As a result, a single Nereda reactor will suffice in Vroomshoop.

The plant in Garmerwolde is currently the largest plant in the Netherlands, with a capacity of 140,000 population equivalents. A Nereda plant with more than three times this capacity is currently being built in Utrecht. De Stichtse Rijnlanden water authority decided to build a demonstration plant back then to examine the application of the technology at this scale. A Nereda® plant was taken in use at the Limburg Waterschapsbedrijf in Simpelveld at the end of 2016, and the Scheldestromen water authority also decided to treat municipal waste water in Breskens using the Nereda technology.

Worldwide, the largest Nereda plant in operation in 2016 is in Deodoro (Brazil). This plant has a design capacity of 480,000 population equivalents and was put into use a few months before the Olympic Games.
The conversion and expansion of the Ringsend treatment plant in Dublin is currently the largest application under development with a design capacity of 2.4 million population equivalents.

Start-up

The participants focused on several themes during the SOON project, in which granular formation and sludge growth logically came first.
While only activated sludge was available at the start-up of the sewage treatment plant in Epe, the other four Nereda plants could use thickened excess sludge from Epe in 2013.
The Nereda plants were monitored intensively to examine the aerobic granular sludge development. The typical granular fraction progress is shown in Figure 1 for illustration purposes, in which two stages are clearly visible.

Figure 1 - Granular sludge development at the Vroomshoop Nereda® plant

During the first phase, a relatively stable sludge concentration is maintained of 4 to 5 grams per liter and the sludge properties are improved through the specifically implemented process conditions. The sludge content and the sludge properties increase simultaneously, in which sludge levels can be achieved far above 10 grams per liter. It is important to emphasize that the required Nereda® plant effluent quality is achieved well within the period necessary to come to mature granular sludge. It will also be clear in this context that new plants that are seeded with Nereda® granules can be operated under design conditions from day one. The described granular growth stage is then no longer applicable.

Phosphorus and nitrogen removal

Although all Nereda installations’ effluent requirements are met within the stipulated guarantee or evaluation period, the SOON participants focused a lot of attention on further optimization of the effluent quality.
The first success of the SOON project in this context, was improving the phosphorus removal at the Epe plant. As is well known in many biological phosphate removal plants, the process is generally satisfactory, but the stability during the summer period often leaves much to be desired.
Essential discussions on this topic between scientists at the TU Delft, designers of Royal HaskoningDHV and end users of the water authorities, led to the understanding in September 2013 that the less effective biological P removal could be a result of the process operation in relation to the oxygen supply.
If the waste water has already been cleaned to a large extent during a Nereda cycle and there is no longer any substrate/nutrient and phosphorus present, oxygen penetrates deeper into the Nereda granules. The so-called ‘bio-P organisms’ are located here and can experience difficulties if this happens regularly and for an extended period. This will eventually affect the biological phosphor removal capacity negatively.

The aeration control at Epe was adapted based on this common understanding. The results from the summer period of 2014 and 2015 unmistakably indicated that the well-known 'summer dip' no longer occurs since the change to aeration control.
It might be worth mentioning here that the insights and experiences gained are not limited to application of the Nereda technology, but that this can also be translated into conventional activated sludge systems.

Suspended solids

As previously noted, the Nereda® plants in Epe and Dinxperlo were designed with effluent filtration. This was considered necessary at the time to meet the stringent effluent requirements (less than 0.3 in Epe and 0.5 milligrams P per liter in Dinxperlo).
When designing these plants, it was decided to send any floating particles with the effluent to the sand filters, to then be removed there. However, no sand filters were included in the next Nereda® plants, and these sludge particles are discharged with the effluent. In practice, this generates average suspended solids effluent levels from 10 to 20 milligrams per liter.

Although these values remain within Dutch standards, they are generally higher than those achieved in conventional plants. A further reduction in the suspended solids effluent concentration in Nereda® plants was therefore an important focus in the SOON project. Moreover, there was even more of a need, as requirements for suspended solids abroad are sometimes considerably stricter than in the Netherlands.

To gain more understanding, turbidity sensors were implemented at all Nereda® plants in 2014. As could be expected, a typical peak emerged at the start of the Nereda® cycle. This peak is caused by particles that float up during the settling and/or discharge phase, forming a thin layer on the surface of the water. After a few minutes, the turbidity stabilizes at a low level.
To improve this structurally, baffles were fitted along the Nereda® reactor’s effluent gutters at the demonstration plant in Utrecht in June 2015, with the aim to stop flushing out the floating layer. The results following this adjustment were very positive, as can be seen in Figure 2. The average effluent suspended solids concentration has dropped to well below 10 milligrams per liter, the level also reached by activated sludge plants. All new Nereda® plants are now based on a standard design with baffles.

Figure 2 - Effluent turbidity before and after placement of baffles (Utrecht)

Conclusions

The development of the Nereda technology was established by the Dutch water sector in a very short time. A successful roll-out in 2016 can already be claimed without any restraint.
More than 30 working plants have since been built in the Netherlands and beyond, or are in the design or construction stage, and a scale was reached of 2.4 million pollution equivalents.
It is expected that dozens of plants will be realized per year from 2017. Agreements have been reached with the Association of Water Authorities to start up new plants with Dutch water authorities abroad. Training of (international) operators, technologists and designers are organized in cooperation with the Dutch training organization Wateropleidingen in the Global Water Academy.

None of this would have been possible without the collaboration of STOWA, the seven Water Authorities, TU Delft and Royal HaskoningDHV. Ten years after the launch of this public-private cooperation, it can be concluded that the stated objectives were more than achieved, and a sustainable alternative to conventional activated sludge systems has been developed. In addition, important optimizations were initiated by the SOON project, that have also contributed to further development of the Nereda® technology. These results have not only resulted in increased performance in terms of effluent quality, but also in a reduced energy and chemical consumption. In addition, the acquired knowledge and experience were turned into even more compact and more cost-efficient designs, as a result of which the competitiveness of Dutch Nereda® technology has increased.

With this result, the Dutch water sector has once again emphasized its image as a leader in the field of water technology. That’s why the technology was awarded the first Vernufteling (ingenuity) award in 2005 and dozens of other (inter) national awards were granted since then, including the Green Technology Award in Ireland in 2016. The Dutch water sector may rightfully be proud of this achievement.

Helle van der Roest
(Royal HaskoningDHV)
Andre van Bentem
(Royal HaskoningDHV)
Cora Uijterlinde
(STOWA)
Ad de Man
(Waterschapsbedrijf Limburg)

Background picture:
The first Brazilian Nereda plant (480,000 population equivalents) during the official opening in August 2016
Photo: Américo Vermelho

Summary

Water authorities responsible for the five municipal Dutch Nereda® plants, are working together on optimizing this technology. This is done in the SOON program (Cooperation in start-up and optimization of Nereda plants).

Remarkable results were achieved. These have not only led to increased performance in terms of effluent quality, but also in reduced energy and chemical consumption. In addition, the knowledge and experience gained was converted into even more compact and cost-efficient designs, as a result of which the competitiveness of Dutch Nereda technology has increased.

^ Back to start
NEREDA

A steep growth curve

Knowledge journal / Edition 2 / 2016

Ecological Key Factor Toxicity

Micro pollutants: How can you determine ecological risks in water?

More and more, new substances are found in European surface waters. Many micro pollutants can be analysed chemically, but the effect of the complex environmental cocktail on the ecosystem often remains unclear. The new Ecologische Sleutelfactor Toxiciteit (Ecological Key Factor Toxicity) is a practical tool to help in determining the ecological risks of chemical pollution in a simple way.

At present there are more than 100 million known substances, part of which end up in the water cycle. Water quality standards (critical concentrations) were laid down in the European or Dutch regulations for a number of substances. These standards provide the basis for the protection and evaluation of the water quality; as long as the concentration of a substance complies with the standard, it is considered that the substance won't lead to ecological impacts.
The use of standards, however, cannot answer all questions. For example, water administrators would like to know what the actual ecological effects are when a standard is exceeded. Is non-compliance with standard always equally dangerous? And what does it mean when multiple standards are exceeded, or when standards lack? How do I assess this wider scope, in a water system analysis?
In practice, it appears that ecology can be harmed if the standards are not exceeded. This is possible because thousands of substances are not analysed regularly and because for many substances there are no standards.

The above questions were the incentive for Foundation for Applied Water Research (STOWA), the Amsterdam water cycle company Waternet, RIVM, Deltares and Ecofide to develop the Ecological Key Factor Toxicity (EKF-TOX). Not as a replacement of the current policies, but in addition to and following on existing policy frameworks and other EKF's. The EKF-TOX model is focused on ecotoxicology and provides the link between water pollution and ecology. It is part of a set of key factors, together providing a picture of the condition of water bodies.

Two-track analysis of environmental risks

The EKF-TOX consists of two tracks. One track, (chemistry), starts from the regular measurements of substance concentrations and works with models. The other track (toxicology) is based on directly measuring effects in biological assays on field samples. The emphasis of both tracks is on the translation of the observed substance concentrations and bioassay effects to the magnitude of ecological risks.

The EKF-TOX results are presented in a traffic light that indicates whether the risk to an ecosystem is high, moderate or low (Figure 1).
The two tracks of the EFS-TOX combined provide a good estimate of the risks micro-pollutants have on the ecology. In specific and/or complex situations, however, it may be desirable to perform additional research with advanced chemical, biological and toxicological methods.

Figure 1 - Schematic representation of the Ecological Key Factor Toxicity (EKF-TOX)strategy, with a two-track screening for chemical risks to the environment.

Chemical track

With the chemical track, work is conducted with measured concentrations of (known and new) organic substances, metals and nutrients. Potential ecological effects due to the chemical mixture exposure are calculated on this basis. With the concept of 'mixture toxic pressure', the severity of the effects that the mixture of bioavailable substances can cause, are quantified.

The toxic pressure is determined by the same method used to derive water quality standards, namely with Species Sensitivity Distribution (SSD) modelling. The maximum acceptable concentration standard of a substance is determined based on known effects on different tested organisms. This analysis method in the EKF-TOX works the other way around: determine what percentage of the tested organisms may be negatively affected by the measured substance concentrations. That fraction of organisms (from 0 to 100 percent) is referred to as the potentially affected fraction (PAF).
This toxic pressure is calculated per substance in the EKF-TOX and the effect of all the substance concentrations is then combined as the toxic pressure of the entire mixture (the multi-substance PAF, msPAF).

The toxic pressure of a location is calculated using a calculation model in which all substance concentrations are entered. The calculation of the mixture toxic pressure of the chemical-track is based on acute (fast-acting) toxicity, because in this way the output has a direct relationship with species loss. The chronic effects will of course also increase with an increase in acute toxic pressure in a series of water samples.

Toxicological track

The toxicological track indicates whether the available combination of substances has an adverse effect on aquatic organisms through effect measurements. Both general toxicity and specific toxicity (geared toward a particular mechanism) are investigated.

In this track, the ecological risk is assessed with a battery of fifteen simple bioassays. These are toxicity tests with live animals, plants or cells. Selected bioassays can be performed by routine laboratories, or it can be outsourced cheaply.
The possible risks from the entire mixture of (un)known organic compounds and their degradation products are analysed with this test battery (costs in 2016, €2,300 ex VAT). This will give a more complete picture of the chemical risks than chemical analyses. The water is concentrated to give an indication of the chronic (slow-acting) toxicity. Because only organic substances are concentrated, the toxic pressure of metals and ammonia are determined via the chemical track.

The results of bioassays do not indicate which substances cause the effects. To get an impression of effects on the ecology, the results are therefore compared to Effect-Based Trigger values (EBT), as ecological risk indicators. The measured bioassay effects are entered into the SIMONI model (smart integrated monitoring) that uses the EBT to calculate a 'SIMONI score' for environmental risks at each site.

The tracks lined up, or sometimes apart

The chemical track and the toxicological track are complementary to each other, so a complete assessment can only be made using both tracks. However, there are exceptions. The chemical track may be sufficient if many concentrations of micro-pollutants are known already, but its ecological risk is unclear (for example, due to a lack of standards). Because the concentrations of thousands of non-analysed substances are unknown, however, a 'low risk' assessment can never be given with this track. The toxicological track can be used to get a first impression of the chemical pollution if little is known of a location. With this track, it can be difficult to give an assessment of 'high risk' without identifying the substances that cause the effect, but extensive chemical research is not necessary if a 'low risk' is indicated.

Validation of the EKF-TOX

Toxicity in the water system is a complex subject, because it involves a huge number of (unknown) substances that can affect thousands of species of aquatic organisms. The added value of the EKF-TOX is that water managers can assess this complex problem in an unambiguous way. Both tracks of the EKF-TOX are validated with comparative research.

Thousands of samples from Dutch waters were therefore used for the chemical track to assess how an increasing toxic pressure has an effect on the species diversity of the macro fauna community. Biodiversity is clearly limited by mixture toxic pressure; an acute toxic pressure of 10 percent is equivalent to approximately 10 percent species loss.
Metals and pesticides often contribute the most to toxicity. An analysis of a collated nationwide monitoring data set of all Dutch water authorities indicated that a mixture toxic pressure level of 10 percent is exceeded in 0.7% of the samples. In 19 percent of the samples, some toxicity was involved but to a lesser extent (msPAF exceeding 0.5 percent).

The toxicological track was validated first by Waternet. An increased environmental risk was demonstrated with the SIMONI-model on three locations where the water quality was influenced by greenhouse agriculture or a sewage treatment plant.
An increased ecological risk was indicated with the two different EKF-TOX tracks on two agricultural locations. Both the SIMONI-score and the msPAF exceeded the indicative trigger values. The SIMONI-model for effect-oriented risk analysis will be validated nationally as from 2016.

Chemical water quality analysis with EKF-TOX

An insightful ecological risk analysis will be available if EKF-TOX is applied in addition to the regular monitoring checking measured concentrations against the standards of the European Water Framework Directive (WFD). The EKF-TOX is specifically aimed at quantifying the ecological risks of chemical mixtures, even if there are no standards.
This makes it possible – for example as policy support – to prioritize locations with this key factor based on environmental risks. The EKF-TOX is only focused on the direct environmental effects, while the standards also take poisoning through the food chain and human risks into account. Because chemical standards always have a safety margin, slight standard exceedances do not need to have an immediate ecological effect. Due to the realistic and unambiguous approach of the EKF-TOX models, tests based on the protective WFD guidelines may more frequently provide a signal of ecological risks than those with EKF-TOX .

Practical tests with the chemical-track indicated that water managers are very happy with the summarizing ability of EKF-TOX; no long tables with standards-checks for all substances, but a single number quantifying the magnitude of the ecological risk. Water boards also got a better understanding of the relative risks of individual substances because the msPAF model specifies which substances contribute relatively most to the toxic pressure.

The Amsterdam water cycle company, Waternet, was the first to apply the regular use of the toxicological EKF-TOX track and to limit chemical monitoring. In the European Union there is an increasing support for integrated monitoring that examines effects as well as substances. For example, tools similar to the EKF-TOX are being developed in the European SOLUTIONS project. The innovative approach of EKF-TOX therefore seems to be a logical next step to implement the ideas of the European Water Framework Directive.

Ron van der Oost
(Waternet)
Leo Posthuma
(RIVM)
Dick de Zwart
(RIVM)
Jaap Postma
(Ecofide)
Leonard Osté
(Deltares)

Summary

Surface water may be contaminated with more than 100,000 chemical substances. With the current monitoring method, it is often difficult to determine the risks of chemical micro-pollutants on the ecosystem. A practical tool was therefore developed with the Ecological Key Factor Toxicity (EKF-TOX) that allows water authorities to easily conduct an analysis of the chemical risks to the ecosystem.

The EKF-TOX examines both substances and effects with a two-track analysis. With the chemical track, the toxic pressure of the mixture of measured substances is determined using a model analysis on chemical concentrations. The toxicological track analyses the risks of the entire mixture of substances with biological effect measurements (bioassays).

Computational models have been developed for both EKF-TOX-tracks that indicate the chemical condition of the water as good, doubtful or poor. In case of a doubtful result, further customized research is required.


Literature


STOWA, 2016. Leo Posthuma, Dick de Zwart, Leonard Osté, Ron van der Oost and Jaap Postma. Ecologische Sleutelfactor Toxiciteit, deel 1: Methode voor het in beeld brengen van de toxiciteit. (Toxicity, an Ecological Key factor, part 1: a method to determine toxicity.) STOWA report 2016-15a.

José Vos, Els Smit, Dennis Kalf, Ronald Gylstra. Normen voor het waterkwaliteitsbeheer: wat kun, mag en moet je er mee? (Standards for water quality management: what can, should and must you do with it?) H2O-Online, December 2015.

^ Back to start

MICRO POLLUTANTS

What are the ecological risks?

Knowledge journal / Edition 2 / 2016

How much water can flow into the Netherlands via the large rivers?

How much water can flow per unit time to the Netherlands in the most extreme situations via a large river like the Rhine? The answer to that question becomes more important, because the climate is changing and standards are becoming stricter. There is a new method to determine the extremely high discharges, in which the behavior of the river upstream of the Dutch border near Lobith is taken into consideration.

In the Netherlands, safety against flooding by rivers, besides the strength of the flood defenses, is strongly influenced by the discharges of the Rhine and Maas at the border near Lobith and Eijsden, respectively. The important question has always been: how much water will then be involved.
The discharge is directly linked to its probability of occurrence: average discharges are common, but extremely high and extremely low flows don't occur all that often. The occurrence of extremely high discharge is modeled with a probability distribution of the annual peak discharges, sometimes also called the ‘working line’ (see Figure 1).

Because absolute safety cannot be guaranteed, we in the Netherlands currently work with a peak discharge with a probability of occurrence that we find acceptable, the so-called design discharge. Using a physical-mathematical river model, this is then translated into water levels along the rivers based on which we then design the dikes, the design water levels.
New insights regularly lead to discussions on the height of the design discharge and whether there is an upper limit as to how much water can flow to the Netherlands via the Rhine. What happens with the embankments in Germany plays an important role.

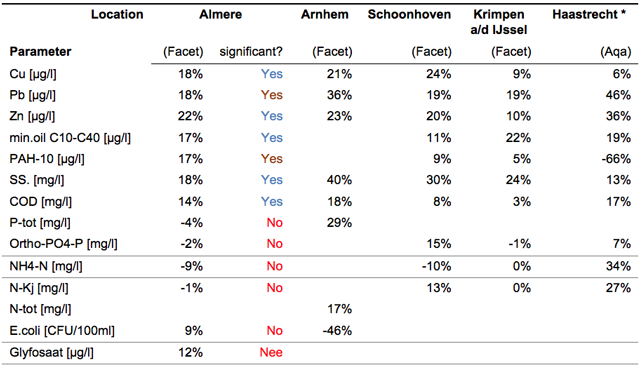
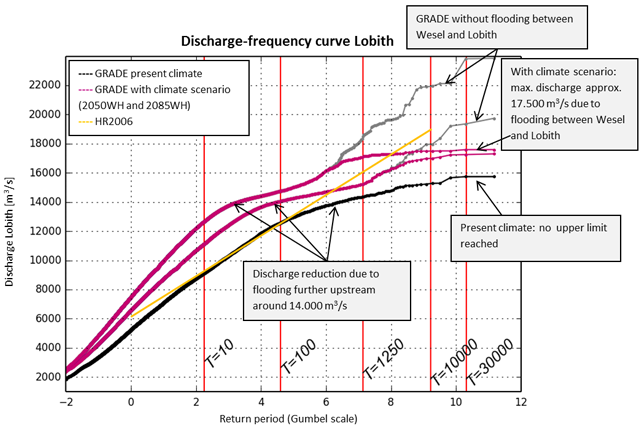
Figure 1 - Various discharge working lines at Lobith. HR2006 represents the working line based on statistical extrapolation, and was used to date to determine design discharge at Lobith

There are areas with an almost unlimited catchment capacity along the part of the Rhine just upstream from Lobith and in this part of the Rhine, the embankments will be flooded at extremely high water levels, or possibly even breach. If those embankments are raised, the discharge capacity will increase. Germany plans to raise those embankments, and the planning is for the work to be completed around 2025. The height of these embankments will then determine the upper limit of the discharge based on which the flood defences will be designed in the Netherlands.

Changes

Meanwhile, the Netherlands has decided to take on a different approach to safety against flooding. Every embankment section is given a maximum allowable probability of flooding, based on an economic assessment of the potential damage and the investment costs in order to prevent it, the probability of loss of life due to flooding, the probability of large numbers of victims in a single flood event and failure of vital infrastructure.
These standards are set out in the revision of the Water Act, which takes effect from 1 January 2017. At many river dikes, this leads to higher standards (lower probability of flooding). The new standards also mean more differentiation in standards between different embankment sections; along the branches of the Rhine, the new flooding probability standard varies from on average once in 300 years to on average once in 100,000 years.
In addition, there is a more explicit focus in the new design tools on geotechnical failure mechanisms, such as piping or instability that can lead to a flood.

The new approach has consequences for the information we require on extreme high discharges.
Firstly, there are now multiple factors (failure mechanisms) that can lead to failure, each with their own probability of failure. The sum of those failure probabilities must be limited to at most the same as the flooding probability standard of the embankment sections. This means each of these partial probabilities must be less than the standard. For each of the partial probabilities, we must therefore look at more extreme events than we currently do.
In addition, the new standards correspond mostly with much lower failure probabilities per embankment section than the current probability of exceedance of the water level (once in 1,250 years). This means we have to look at much more rare events, sometimes with a probability as low as once in 100,000 years on average.

Secondly, the so-called 'length effect' also plays a role: due to geotechnical uncertainties in particular, with identical embankment sections, a longer stretch of embankment has a greater probability of failure than a shorter stretch of embankment. After all, the probability of a relatively weak spot being present in a longer embankment section is greater than in a shorter section.
Thirdly, the duration of the discharge wave is of interest for some of those geotechnical failure mechanisms. For example, a rapidly declining water level can lead to sliding of the outer slope of the embankment.

In short, as far as the river discharges at the border are concerned, we need to know more, and about more extreme discharge events. The current practice of statistical extrapolation of peak discharges measured over approximately 100 years is no longer adequate.

GRADE

The Directorate General for Public Works and Water Management, along with Deltares and KNMI, have developed a new system to model extreme high discharges: GRADE (Generator of Rainfall and Discharge Extremes). This is based on long-term time series of temperature and precipitation (derived from meteorological data). Each of these sets is imported into a hydrological model (HBV) , which calculates the inflow into the river. The inflow then serves as input for a hydrodynamic model (SOBEK), that calculates the propagation of the discharge wave through the river, and eventually the discharge that enters the Netherlands at Lobith.

By repeating this calculation many times and by selecting the most extreme events from the results, a picture is obtained of the most extreme discharge waves, of both the peak discharges and the development in time. The main advantage is that it is possible to include floodings in Germany or Belgium in the model, but also emergency measures, such as laying of sand bags.

In principle, with GRADE we have a method to answer the question as to whether there is an upper limit of the discharge at Lobith. After all, GRADE includes flooding in Germany. However, SOBEK is a one-dimensional model, that is, the entire cross section of the river is compressed into a single line with 'containers' for water storage/flooding linked to it. It does however take into account that flooded areas can be 'full' along large parts of the Rhine, so they no longer have a reducing effect on the water level downstream. In addition, there are schematization effects, for example when outlining flooding just upstream from the Dutch border, between Wesel and Lobith.

From additional analyses (recommendation by the Expertise Network on Flood Protection (ENW): 'Does the Rhine have a maximum discharge at Lobith?’) it appears these floodings between Wesel and Lobith are still strongly underestimated in GRADE, so the calculated extreme discharges are overestimated. Two-dimensional models that will solve this problem are still under construction.

Estimating the upper limit

In order to reach a reliable estimation now already, all the SOBEK schematized profiles in GRADE were inspected one more time on the basis of digital elevation maps, concluding that the greatest sensitivity lies in floodings between Wesel and Lobith.

A more accurate consideration of the water flow over the embankments there, based on the proposed embankment heights in 2025, led to the conclusion that the discharge at Lobith will most likely not be able to exceed 17,500 cubic meters per second, not even under very extreme conditions (the current design discharge is 16,000 cubic meters per second).
If the embankments between Wesel and the border were infinitely high and strong, the peak discharge at Lobith may rise up to 23,000 cubic meters per second, assuming the KNMI'14 climate scenario WH in 2085. The last stretch of embankments before the border therefore acts as a kind of safety valve for the Netherlands.

The water that flows over the German embankments can however cause a lot of damage and misery, possibly even fatalities. It can reach the Netherlands 'through the back door'. Flood calculations show that the water through the Achterhoek can even reach Zwolle. Truncating the extreme discharge waves also doesn't mean this will no longer pose any problems for the river embankments if they are high enough. With a truncated wave, the peak after all lasts longer, leaving a greater probability of weakening the embankments.

Some German embankments can already be flooded at 14,000 cubic meters per second, for example between Bonn and Düsseldorf. These areas have a limited volume, however, so with extreme discharges they are already full before the peak arrives and their the truncating effect is lost. The levelling of discharges around 14,000 cubic meters per second, then rising again is visible in the GRADE results (Figure 1), and was also indicated in calculations with a two-dimensional flooding model. So this doesn't provide a real upper limit of the discharge at Lobith.

Conclusion

Floodings in Germany ensure a limitation of the discharge reaching the Netherlands. With a discharge from around 14,000 cubic meters per second, these floodings ensure a reduction in discharge, but at higher discharges, the flooded areas fill up, so the positive effect is lost. However, at discharges of approximately 17,500 cubic meters per second, areas just before the Dutch border (between Wesel and Lobith) will also be flooded, with hardly any limitation in the storage capacity.
This creates an upper discharge limit at Lobith. The truncation of the extreme discharges at Lobith is therefore good news for flood protection in the Netherlands, but it's no reason to celebrate yet. The GRADE approach with the inclusion of floods provides a realistic approach of the discharges at Lobith and allows for significantly lower dikes compared to the statistical extrapolation.

This article is based on GRADE research by the Department of Public Works and Water Management, Deltares and KNMI and on a recent recommendation of the Expertise Network on Flood Protection: ‘Heeft de Rijnafvoer bij Lobith een maximum?’ (Does the Rhine have a maximum discharge at Lobith), August 2016 (www.enwinfo.nl)

Matthijs Kok
(Expertise Network on Flood Protection)
Joost Pol
(HKV)
Huib de Vriend
(Expertise Network on Flood Protection)

Summary

The design discharge' plays an important role in flood protection along the rivers. So far, this discharge was based on statistical extrapolation of measured discharges at Lobith. This method has the disadvantage that it doesn't consider the behavior of the river upstream from Lobith during discharges that have never been observed so far.

The Department of Public Works and Water Management has developed a new model system for modeling of extreme high discharges in rivers: GRADE (Generator of Rainfall and Discharge Extremes). The GRADE approach including floodings in Germany provides a more realistic approach of the extreme discharges at Lobith and allows for significantly lower flood defenses compared to the statistical extrapolation.

^ Back to start
LARGE RIVERS

Predicting extreme situations

Knowledge journal / Edition 2 / 2016

Water quality management

Remote sensing is becoming less and less remote

Remote sensing, observing the water-system remotely: to many water managers this still sounds like a promise for the future; or is that future now within reach?

Water systems are often vast and their state varies strongly over locations and in time. Reliable and cost effective monitoring is quite a challenge for water quality managers.
Traditionally, much value is assigned to manual measurements in the field, because of the often-great precision (detail level), but the accuracy of the information obtained may be limited by inadequate representativity of locations and/or times of sampling.

Water managers are very interested in remote sensing. For example, from the point of view of cost savings that can be provided by (semi) autonomous observing systems. In addition, there is a need for more and better data spread over space and time to reduce the risk of accidentally differing observations (sampling biases). Another argument is that it is precisely the combination of different sources of monitoring data that provide more insight in the functioning of the entire water system. In addition, there is a growing need to be able to relate and visualize data sets spread over space and time to each other in a convenient way.

The challenge is to make the right choice in these combinations and to incorporate these techniques properly into existing monitoring programs.

Remote? Sensing?

Quite often, people associate remote sensing directly to earth observation satellites, but a remote sensing platform can be virtually anything: a person, a measuring mast or a set-up on a ship, a drone, an air plane or indeed, a satellite. To determine the form of remote sensing applicable for a problem, it makes sense to separate the sensor technology from the measuring platform.

Optical remote sensing uses the incoming sunlight and records the (apparent) colour and turbidity of the water. In addition, the area coverage by duckweed or water plants and other characteristics related to water quality and ecology, such as foam or scum layers, can be detected. The influence of vegetation and activities by animals or humans on or near the water can also be observed. Because remote sensing samples the water from above, only characteristics of the upper part of the water column can be determined. The clearer the water the deeper the observable portion of the water column. In relatively clear or shallow waters also the bottom can be observed.

Using retrieval algorithms, area maps can be made of optical water quality parameters. The most commonly retrieved quantities are:

• Chlorophyll (a) concentration
• Concentration total suspended matter, TSM
• CDOM absorption (Coloured Dissolved Organic Matter, i.e. humic acids)
• Kd extinction coefficient over PAR (Photosynthetically Active Radiation) or as a function of wavelength.

In addition, in some cases it is possible to obtain information about
• Secchi depth or euphotic depth
• Phytoplankton types (PFT) or target species such as cyanobacteria
• Primary production
• Aquatic plants

Sensor technology

Digital cameras detect the visible light in a limited number of wavelength bands (usually red, green and blue) of the visible light spectrum and combine it into a single colour photo made up of pixels.
Spectrometers are common for environmental monitoring: these sensors detect the light in many more specific bands of the wavelength range, from ultraviolet to infra-red. Multi spectral spectrometers use from a few to dozens of bands around specific wavelengths, while hyper spectral sensors use narrower bands in a contiguous part of the spectrum.

Different environmental quantities can be determined from the observed reflectance spectrum (i.e., the perceived colour of the water, given the spectrum of the incident light). The incident light from the sun is scattered in water by silt and algae and absorbed by dissolved material and algae pigments in certain wavelengths. Translating the composition of the water and the substances contained therein on the basis of the spectral data is called retrieval: inverse modelling based on knowledge of the absorption and scattering properties of the water and the substances contained therein. Since the absorption and scattering properties of the plankton species, suspended particles and humic acids may vary per water system; calibration to local conditions is often required. This means that remote sensing of optical water quality can never do completely without in situ measurements for calibration and validation. The appropriate sampling plan for the calibration measurements depends on the extent to which the bio-optical characteristics vary in a system, but in general calibration measurements are required less often than normal water quality measurements in regular monitoring programs.

Platforms

The choice of observing platform largely determines the resolution and range at which measurements can be made. A large number of sensors with similar operating principle can be used on different platforms allowing the measurement of similar characteristics at different scales.
Manual measurements by a person from a ship or dock using specifically designed hardware linked to a smart phone, can offer significant coverage – if properly organized. Such participatory monitoring may be less precise, but it can be informative thanks to a larger number of samples.
Drones or aircraft offer a more autonomous collection of data, although these platforms also require personnel. Applications on a measurement mast or satellite are often fully autonomous: the data are obtained for a fixed area with a fixed frequency. These data are sent to a data server and processed.

Earth observation satellites can be roughly split into two types: platforms in a relatively low orbit around the Earth (approximately 700 to 800 kilometres high) or in a high geostationary orbit (around 36,000 kilometres high).
In a low orbit, the satellites move in a North-South direction (or vice versa), thus regularly sampling the same location on the ground. The return frequency of measurements depends on the satellite orbit and the width of the field of view of the sensor. Geostationary satellites constantly observe the same area on earth and can therefore deliver data with a high time resolution (for example, every 15 minutes), but due to its high altitude, with less spatial detail.

Apart from the orbit, the measuring principle determines the average sampling resolution in time and space. Optical measurements require the light of the sun. The sunlight passes the atmosphere twice (natural and reflected light) and the sensor signals are therefore affected by gases and aerosols in the atmosphere. The quality of the signal also varies with the time of day and the season (angle of the sun and day length).
In practice, there is a balance between the spectral resolution, sensitivity (signal-to-noise ratio) and spatial resolution that a sensor can offer.
Most satellite missions in low orbit are a compromise; they use multispectral sensors and have spatial resolutions of ten to several hundreds of meters. Hyper spectral sensors are already prevalent in remote sensing by drone or aircraft, and the sensor technology is constantly developing. Italy and Germany, among others, are currently preparing for hyperspectral satellite missions. More detail and better differentiation on specific colour differences from space will allow for a next generationof information products.

Data processing and data services

The supply of remote sensing data is growing strongly, e.g. thanks to the Copernicus program of the European Union.
This program includes a comprehensive earth observation component with Sentinel satellites at its core. An important goal is to make earth observation applicable for a wider audience of users. Copernicus stimulates the development of data and information services that allows non-experts to take advantage of the wealth of information too. In addition to the EU and ESA facilitated supply, there is for example also a range of American satellites available. Besides, there are commercial missions, delivering very specific, often high-resolution products.

Rijkswaterstaat (the Department of Public Works of the Dutch Ministry of Infrastructure and the Environment) and the Port of Rotterdam authority gained practical experience with the use of remote sensing to monitor water quality in the Netherlands over the past decade.
The Department of Public Works had a number of atlases prepared for Markermeer, IJsselmeer and the North Sea based on suspended matter and chlorophyll data by forerunners of the current Sentinel satellites. In addition to patterns in space and time, these atlases provide graphs of influencing factors, such as wind, solar radiation and waves and calculations of concentrations based on numeric water quality models.
The Port of Rotterdam authority has prepared atlases with composite images of suspended matter in the southern North Sea for the period 2003-2011 to underpin the environmental impact monitoring during the construction of the Second Maasvlakte. The Second Maasvlakte study has been based on the combination of satellite data with other data. By integrating the suspended matter maps from the satellite with a computer model of the North Sea, a reconstruction could be made of the concentrations in the deeper water layers (out of sight of the satellite) and the effect of the construction of the Maasvlakte on suspended matter could be separated from natural background fluctuations.

Water managers can boost the applicability of remote sensing by starting to pick up these data and information products for their own benefit and to evaluate their use. Many consulting companies and knowledge institutes are interested to offer data and information services in part or fully based on satellite remote sensing: the quality and accessibility of remote sensing data are clearly getting beyond the research stage.
Still, by collaborating with knowledge institutes and companies, the quality and applicability of the data can be improved further, for example by fine-tuning the retrieval to specific water bodies or to extend it for other quantities. In such cooperation, value can also be added to the data by combining it with other data sources and model calculations.

Remote Sensing allows for a higher level of detail or more frequent insight in the functioning of the water system. The required level of detail in space and time is the starting point to come to the optimal combination of sampling, platforms and sensors.

Meinte Blaas
Ellis Penning
Marieke Eleveld
Miguel Dionisio Pires
Anouk Blauw
(Deltares)

Table 1 - Combination of platforms and sensors to determine water quality characteristics

Background picture:
One of the first Sentinel 2A recordings ('colour composite') of the western part of The Netherlands taken in August 2015. The colour and turbidity differences in the large surface waters are mainly caused by variable concentrations of algae, suspended solids and dissolved organic matter (humic acids). The image of lake Markermeer is for instance dominated by the prevailing silt concentrations while relatively more algae are observable in lake IJsselmeer. The influence of the distribution of river water from the New Waterway is visible in the North Sea coastal zone. The relatively fresh water spreads gradually northwards in a wavy pattern along the coast, creating variations in colour and turbidity in the water.

Summary

For long, remote sensing has had a technically complex image, an information source aimed at the research community. For those less informed, the technology seemed difficult to implement as an alternative for or in addition to in situ sampling.

However, times are changing. For example, thanks to Google Earth and Bing Maps and affordable drones, the general audience has grown accustomed to remote sensing as directly usable information. The same applies to water boards and other water managers: remote sensing is not so remote anymore.

Which platform and what technology can best be used, depends on the desired level of detail in space and time.

^ Back to start
WATER QUALITY

Remote sensing: how to use it

Knowledge journal / Edition 2 / 2016

Dutch drinking water sector

Benchmarking:
How can that lead to improvements?

Since 1997, the performance of Dutch drinking water companies are compared to each other using a benchmark. After a period of much improvement, the process now seems to be stagnating. Why? And what can be done about it?

Drinking water markets are natural monopolies in the Netherlands: there is a single provider in a given area. In such a market monopoly, the average cost of production can be minimized. The risk of a monopoly is that the provider may abuse its exclusive rights of supply, either by increasing the price or reducing the quality. This has negative consequences for consumers. To prevent this from happening and to ensure economic efficiency, public supervision is necessary.
The Dutch drinking water benchmark is an important tool in Government supervision of the Dutch drinking water market.

Benchmarks are conducted in the drinking water sector to gain insight in the performance of drinking water companies. Furthermore, benchmarks present an incentive for improvement for the benchmarked companies. This article provides insight on why companies will improve as a result of a benchmark and provides an answer to three questions:

1. Which mechanisms – resulting from a benchmark, will encourage benchmarked drinking water companies to improve?
2. Do these mechanisms still work sufficiently in the Dutch drinking water benchmark?
3. How can further improvements be stimulated?

The research is based on survey data from the Dutch drinking water benchmark and interviews with directors and benchmark coordinators of seven Dutch drinking water companies. The findings of this study can also be used for benchmarks in other countries and sectors.

The context

Benchmarks are conducted to gain insight in the performance of water companies. The purpose of a benchmark is to encourage companies to perform better by measuring the performance explicitly. Thus, companies are encouraged to further improve business processes.

The mechanisms originating from a benchmark, which stimulate the benchmarked companies to improve, are called improvement mechanisms. The functioning of these improvement mechanisms is displayed schematically in Figure 1.

Figure 1 - Drivers for performance improvement

Figure 2 - Drivers for performance improvement with feedback loop

When the improvement mechanisms of a benchmark are known, it is possible to explain the origin of behavioral change, the improvements and any stagnation of further improvements, and to search systematically for new impulses to stimulate further improvements.

This research identifies five improvement mechanisms for drinking water benchmarks. The first improvement mechanism is the learning effect of a benchmark. Companies that score low on the benchmark, can learn from high scoring companies. In addition, the transparency of the companies increases through benchmarking. Government and consumers gain insight in the performance of the participating companies. Companies are eager to show they perform well; This provides an incentive for improvement. Benchmarking creates an environment of virtual competition: companies compete with each other for the top spot in the benchmark. This too is a benchmark improvement mechanism. Fourthly, there is the fear of further government intervention at drinking water companies. To prevent this, they want to show they perform well and that more government intervention is not needed. In addition, from a personal sense of honor, directors of drinking water companies would like a high position on the benchmark, this is the fifth and final improvement mechanism, the 'prestige of the company and its Director'.

The benchmark results lead to a change in the behavior of the participating organisations through identified improvement mechanisms. Stagnation of improvement is a sign that the impact of the improvement mechanisms has declined and could be a reason for benchmark adjustment.
The improvement mechanisms can also be used as a framework to assess the impact of new design choices for a benchmark, as shown in Figure 2. The influence of the new design choices can be analysed in a structured way, by estimating the effect of these design choices on the improvement mechanisms.

Application on the Dutch drinking water benchmark

The Dutch drinking water benchmark was executed for the first time in 1997. The performance of the Dutch water sector has improved since this first edition. The efficiency of the companies in the sector has improved by an average of 35 percent since 1997. It seems improvements as a result of the benchmark has since came to a halt. There are a number of explanations for this.

Firstly, there is less variation between the drinking water companies in the benchmark results. Variation is needed in a benchmark to differentiate between a good and poor performance. If the variation decreases, then so does the differentiating ability between good and bad.
The variation has reduced for two reasons. Firstly, there are less Dutch water companies than in 1997 (then 23, now only 10). Secondly, the variation decreased as a result of the drinking water benchmark. Organizations specifically take the initiative to improve, if the benchmark results are low. Therefore, benchmarking often leads to convergence to an average performance level. In addition, drinking water companies believe the remaining variation is to a large extent caused by external factors on which they have no influence.
The remaining variation is therefore not seen as an incentive for further improvement.

A second explanation is that participation in the Dutch drinking water benchmark has become mandatory for all Dutch drinking water companies in 2012. The companies themselves consider this a negative development. The benchmark now has two goals; besides an improvement objective, also an accountability objective. If these two goals exist next to each other in a benchmark, organisations can end up focusing too much on showing their performance meets the standard, so the improvement target comes under pressure. If benchmarking becomes mandatory, the chance of unintended consequences increases: This means the measurements become targets and as Goodhart's law states: When a measure becomes a target, it ceases to be a good measure.

A third explanation is that the Dutch potable water benchmark has no focus on the future. This does not match the character of drinking water production, where investments often have a depreciation period of 30 to 50 years. A future focus for companies could be included in the benchmark by adding performance indicators, for example for risk analysis, asset management, sustainability and innovation.

The fourth development for further stagnation in improvement as a result of the benchmark, concerns the experienced financial pressure. Innovation can lead to improvements of business processes, but also means you will be exploring uncharted areas. This increases the risk that the results will be less than expected, which in turn can lead to a worse score on the benchmark.
Benchmarking thus rewards reproduction of the known and punishes innovation and investments.

As a result of these four developments (less variation, obligatory character of the benchmark, no focus on the future and high financial pressure), the impact of the improvement mechanisms has decreased, and nowadays there is less incentive for improvement from the Dutch drinking water benchmark than before.
Table 1 represents the influence of these four developments on the individual improvement mechanisms.

New strategies

Due to the aforementioned developments, the incentive for improvement as a result of the benchmark has decreased. However, the improvement mechanisms can also be used to analyse the impact of new strategies in a structured way, by estimating the effect of the strategies on the improvement mechanisms.
Four new strategies are examined in this study. The first alternative is to add new themes to the benchmark, to add variation, this has a positive effect on the improvement mechanisms. This also reduces the focus on finance, because this is being compensated by other important themes.
A variation on this first strategy is making the benchmark adaptive. An adaptive benchmark is a benchmark that has the possibility to adjust the benchmarked themes based on changes and expected changes in the context of the Dutch drinking water sector. This has the same advantages as the first alternative; only these benefits are stimulated again and again because the themes constantly change.
A third alternative is to increase the number of participants, as for example is done in the European benchmark. Variation increases with more participants, with the additional positive influence on the improvement mechanisms. The fourth and last alternative is the involvement of consumers in determining the benchmarked themes or determining weights for the themes.

Table 2 shows an estimate of the influence of these four new strategies on the improvement mechanisms. This assessment is based on an extrapolation of the findings from the interviews.
The table shows that all four new strategies stimulate further improvements. This means that the incentive for improvement following the drinking water benchmark will be increased with the introduction of these strategies.
This research will further focus on two of the four strategies: making the benchmark adaptive and involving consumers in determining the benchmark themes or allocating weights to the benchmarked themes. These two alternatives have the most positive impact on the improvement mechanisms.

Conclusion

This article identifies the improvement mechanisms resulting from drinking water benchmarks. Using these improvement mechanisms, it is possible to explain improvements as a result of benchmarks. It explains why improvements are currently stagnating, and it creates the possibility to analyse the influence of new strategies on the benchmark in a structured way.

The most promising new strategies for the Dutch drinking water benchmark are the creation of an adaptive benchmark and involving consumers in the benchmarking process. Further research is needed to develop the two proposed strategies. It is expected that these two strategies will create a new incentive for the benchmark, and the improvements as a result of the benchmark will thereby increase.

Marieke de Goede
(TU Delft)
Bert Enserink
(TU Delft)
Ignaz Worm
(Isle Utilities)
Jan Peter van der Hoek
(TU Delft and Waternet)

Table 1 - Overview of the influence of the developments ‘less variation’, ‘mandatory character’, ‘no focus on future’ and ‘financial pressure’ on the five improvement mechanisms: ++ very positive; + positive; 0 neutral; - negative; -- very negative

Table 2 - Overview of the influence of the new impulses on the five improvement mechanisms: ++ very positive; + positive; 0 neutral; - negative; -- very negative

Summary

Benchmarks are conducted to gain insight in the performance of (drinking water) companies, and form an incentive for improvement. Improvements as a result of a benchmark are the result of improvement mechanisms: learning effects, increased transparency, virtual competition, avoidance of further government interference and the prestige of the Director and the company.

The Dutch drinking water sector has been benchmarked since 1997 and has led to many improvements in the sector. Various developments have resulted in the stagnation of further improvements: the variation on the benchmarked performance indicators have decreased, participation in the benchmark has become mandatory, the benchmark focuses on the past and has no focus on the future and participating organisations experience a high financial pressure.

Four new strategies were examined and the influence of these strategies on the improvement mechanisms has been analysed. The two most promising alternatives are making the benchmark adaptive and involving consumers in the benchmarking process. This increases the impulse for improvement as a result of the drinking water benchmark.


Literature


Goede, M. de; Enserink, B.; Worm, I.; van der Hoek, J.P. (2015), Drivers for performance improvement originating from the Dutch drinking water benchmark, Water Policy, Uncorrected Proof (2016)

VEWIN, Water in zicht 1997 - 2012 - vewin.nl/publicaties

^ Back to start

BENCHMARKING

How to achieve improvements

Knowledge journal / Edition 2 / 2016

New approach to assessment and design

Flood defences:
How to deal with uncertainties?

How can the probabilities of floods be reduced to a socially acceptable level? As of 2017, that will be the starting point when designing and assessing flood defences in the Netherlands. The goal is to achieve a better protection at socially acceptable costs. But how do we take uncertainties into account in this process?

In order to assess and design its primary flood defences, as of 2017, the Netherlands will transit from an approach based on the probability of exceedance of water levels to an approach based on flood risk. In the new approach, the main objective is no longer primarily to guarantee safety when design water levels occur. Instead, the focus is on reducing the risk of a flood to a socially acceptable level.
This transition requires a different way of dealing with uncertainties. Uncertainties should no longer be dealt with by applying safe premises and (inadequately substantiated) safety factors, but they should be taken explicitly into account in the risk analysis.

It is a common misconception that the inclusion of uncertainties automatically means flood defences are less likely to pass the safety assessment or should be designed stronger. In this article, we show that fully including the uncertainties in many cases can actually prevent unnecessary strict safety requirements and to a more effective design.

Probability of failure of a flood defence

The probability of failure of a flood defence is the probability (per year) that the load on the defence will exceed the strength at some point. The failure of a flood defence is a complex process, with different stages or partial processes.
In assessing and designing flood defences, various components and failure mechanisms of the flood defence are considered. With failure definitions, we explicitly state what we regard as failure. Computational models were developed to describe under what conditions failure will occur. After properly schematising the flood defence and surroundings, the model is applied to verify whether the flood defence meets the reliability requirement derived from the statutory flood protection standard.

Both the load and the resistance of a flood defence are uncertain. That is also the reason why a safety standard is expressed as a probability. Some uncertainties can be reduced with additional research and measuring campaigns. However, absolute certainty is an illusion. The actual strength of a dike can never be established with complete certainty, because neither the dike nor the subsoil can ever be measured completely.
In addition, flood defences are designed and assessed on the basis of extreme water levels and wave conditions that have never been observed and of which the probability of occurrence can only be roughly estimated. Finally, simulation models of failure mechanisms are also a source of uncertainty because these are never a perfect representation of reality.

Mapping uncertainties

Uncertainties form the basis of failure probability calculations. Considering uncertainties in the safety assessments of flood defences in The Netherlands is not new. For example, previous assessments took into account the natural variability in hydraulic loads. However, knowledge uncertainties were not considered, which means the probability of high loads was potentially underestimated. On the other hand, extra safety margins were adopted on the resistance side.

Applying extra safety margins without a good sense of the uncertainties, can lead to (unnecessary) strict assessment rules. In the new approach based on flood probabilities, the objective is therefore to explicitly consider relevant uncertainties. If these uncertainties would be incorporated based on the original assessment rules, they would basically be considered twice. A certain safety margin has already been included in the original assessment rules, after all. The assessment rules are therefore adapted to the new approach.

An example of such an adaptation is the 'critical overflow' of a grass revetment on the inner slope. Once the actual overflow rate exceeds the critical overflow rate, the grass revetment is assumed to fail in the calculation models. Because of the uncertainty in the actual resistance of the revetment, relatively low values were generally chosen for the critical overflow in the past, to prevent the revetment from being erroneously approved. In the new approach, the critical overflow rate is no longer a single fixed value, but a variable with a range of possible outcomes and associated probabilities of occurrence. The new approach allows choosing a much higher average value for the critical overflow rate than the fixed chosen 'safe' values from previous assessments.

Dealing consistently with uncertainties

A major advantage of the approach based on flood probabilities is that one can deal with all identified uncertainties in a consistent and balanced way.
For example, if uncertainties in the hydraulic loads are large, it is also perfectly justifiable to construct a stronger flood defence.
However, because all relevant sources of uncertainty are taken into account, the idea may arise that the accumulation of uncertainties may result in needless rejection of existing flood defences and in unnecessary costly designs of new or improved flood defences. That idea is not correct. After all, considering uncertainties means taking into account deviations from the initially estimated values; both favourable and unfavourable. By including uncertainties explicitly instead of discounting them in safety factors ('hidden safeties'), unintentional and unnecessary conservative assessments and designs of flood defences may be avoided.

Practical perspective

We provide managers of flood defences some practical examples as to how to avoid too conservative an approach in assessment and design.

1. Schematise the flood defence as accurately as possible
Computational models are used to calculate the loads on, and resistance of flood defences.
The real world situation must be translated/converted into information with which to create a working model. This process is referred to as ‘model schematisation’. The more information is available, the more accurate the schematisation can be carried out. Where a conservative approach was previously often opted for in designing the flood defence, the objective nowadays is to assess the flood defence as accurately as possible. By explicitly quantifying the uncertainties, unnecessarily conservative assumptions may be avoided.
If sensitivity analyses indicate a particular factor has a significant influence on the design or the assessment results, additional (soil) surveys can be of added value. Factors with limited influence need no further attention. It is therefore advisable to carry out analyses as an iterative process that is not limited to a single analysis. Knowledge on model sensitivities helps in better dealing with uncertainties in the design and assessment procedures.

Old design plans are often used as the basis for a calculation for a design or safety assessment. Those design plans were often drafted based on conservative assumptions. If it is not possible to demonstrate that a (design of a) flood defence meets the standards based on old designs, it might be beneficial to reconsider the model schematisation. Experiences in recent reinforcement projects showed that reviewing the schematisations and doing additional research has led to more dedicated schematisations and lower design costs.

2. Use scenarios for the presence of foreshores and of objects influencing the resistance of a flood defence
In previous assessments conservative assumptions were made on the influence of foreshores and objects (like trees, benches, houses etc.) on the resistance of the flood defence. In the new approach, these can be included as a scenario. Thus, one no longer needs to only consider the 'pessimistic' scenario of a washed away foreshore or a fallen tree. Instead, the probability of occurrence of such scenarios can be included explicitly. This will generally result in less conservative designs and assessments.

3. Consider a possible residual strength
Some dikes possess a significant residual strength. That means the definition of failure may possibly be very far removed from actual failure (flooding). For example, if the first stone is struck from the dike revetment, this doesn't mean the dike is immediately breached, especially not if the core of the dike consists of clay. The more explicit consideration of residual strength may lead to a less conservative approach in future. Such consideration, however, still requires significant knowledge development. Where it is suspected that residual strength may be relevant, we recommend acquiring a tailor-made safety assessment.

4. Tailor-made approaches as an alternative to generic calculation rules
There is always a dilemma between opting for generic applicability of models or the accuracy of these models. The drawback of a generically applicable set of safety assessment rules is that local-specific conditions are not always correctly accounted for. It is therefore recommended to consider the complexity and specific characteristics of the location in all aspects of assessment and design. When the model schematisation is carried out in more detail, potentially conservative assumptions are critically evaluated and local data is used, it is to be expected that flood defences are less likely to incorrectly fail the safety assessment and that designs will be less costly. In other words: a lot can potentially be gained by using more location-specific information.

Sharing knowledge and experiences

The quality of designs and assessments depend on three factors: people, measurements and models. Models are used to calculate the extent to which dikes comply with the safety standard. Model calculations are only meaningful if these are based on enough measurements of sufficient quality. And well-trained people are needed to consciously and purposefully address the complex process of the safety assessment. The ability of correctly evaluating assessment results is crucial in choosing and implementing the correct steps in the process.

Models and measurements have uncertainties, which in principle can be reduced. It requires well-trained people to make informed and deliberate choices. This underlines the importance of training and pilot projects. It is also important to share practical experiences. Fortunately, the sharing of knowledge and experience is high on the agenda in the Netherlands. As a consequence, the flood defence community is increasingly well equipped to carry out its task, so from 2017 onwards to implement the new safety standards more accurately.

Ferdinand Diermanse
(Deltares)
Han Knoeff
(Deltares)
Deon Slagter
(Department of Public Works and Water Management-WVL)
Herman van der Most
(Deltares)

Summary

As of 2017, the Netherlands will adopt a new approach in flood risk management. In the new approach, the main objective is no longer primarily to guarantee safety when design water levels occur. Instead, the focus is on reducing the risk of floods to a socially acceptable level.

By explicitly considering uncertainties, instead of using 'hidden safety margins', in the new approach a flood defence can be assessed in more detail and the design can be rendered more effective. How that approach can be addressed in practice, is set out in this article.

This new approach helps to better protect the Netherlands against floods at socially acceptable costs.

^ Back to start
FLOOD DEFENCES

How to deal with uncertainties

Knowledge journal / Edition 2 / 2016

Storm water run-off

What is the real removal efficiency of sedimentation facilities?

A little rain to wash away the dust' is an ancient folk wisdom. And so it is: storm water run-off collects a lot of contaminants and where there are separate sewer systems, it ends up directly in the receiving water body. In order to limit these emissions, many sedimentation facilities were put into place at the beginning of this century. However, their removal efficiency is often much lower than manufacturers and suppliers claim. Why?

More than 95 per cent of households in the Netherlands are connected to a so-called gravitational drainage system. A substantial part thereof (22 per cent) consists of separate sewer systems, that is, a foul sewer for the sewage and a storm sewer for the storm water. Storm water systems take care of the drainage of almost 30,000 hectares of surface and they ensure 144 million cubic meters of storm water is discharged in receiving water body annually.

Around the turn of the century, numerous decision trees were popular. This way, suitable measures could be selected for the treatment of this storm water. This usually implied the construction of so-called sedimentation facilities.
These were relatively cheap to deploy and, based on international literature, would removal efficiency pretty high removal rates. However, an extensive investigation in Arnhem between 2005 and 2007 indicated that measured removal rates remained far below expectations based on international literature. In Arnhem, this was mainly due to poor settling of suspended solids in the storm water run-off.

The question was whether the Arnhem results were representative for all the Dutch storm water run-off, and if so, what distinguishes Dutch storm water from storm water abroad. To answer that question, research was done on the removal efficiency of plate separators and on the availability of suspended material in storm water run-off at locations in Schoonhoven, Krimpen aan den IJssel and Haastrecht, and at three locations in Almere.

Actual removal efficiencies

The removal efficiencies of plate separators in Almere, Arnhem and Schoonhoven, Krimpen aan den IJssel and Haastrecht are included in Figure 1. It was also determined for Almere whether the removal rates are significantly different, in other words: is the measured removal efficiency greater than the measurement uncertainty?

Figure 1

Significant positive removal efficiencies were measured in Almere for copper, zinc, mineral oil, suspended components and COD. With parameters for which no significant removal efficiency was measured in Almere (nutrients, bacteria), the measured removal efficiencies were also sometimes nil or negative in the other measurement projects.
The average measured removal efficiency for almost all parameters was in the same range for all measurement locations.
The settling velocity was determined by performing sedimentation tests with storm water run-off that was sampled just upstream from the storm water outlets. The flow rate and the average concentration of the storm water run-off per storm event were also measured at these locations.
Almere used a plastic column with a drainage tap a few centimetres above the bottom to determine the settling velocity. This column (with a diameter of 125 mm) was filled with a well-mixed sample quantity (approximately 1.5 litres, so a water level of 100 to 122 millimetres).
A small amount (30 ml) of the sample was drained periodically over two hours and analysed on turbidity. The turbidity of the sample represents a measure of the amount of suspended solids. A linear relationship was assumed between the turbidity and concentration of suspended solids. A similar measurement principle was used for the other locations.
The settling velocity was calculated for each tapped sample by dividing the water level in the column by the settling time. This settling velocity is comparable to the surface load of for example a plate separator where a flow rate (in cubic meters per hour) is treated by a surface of blades (in square meters) so this load gets the same unit in cubic meters (or m/h).
The results of the three locations combined are used to determine the potential removal efficiency of a sedimentation facility. The potential removal efficiency for suspended substances is the removal efficiency that can be expected if a facility is optimally designed. To determine the potential removal efficiency, the load of suspended substances per storm event is multiplied by the sedimentation based on the settling velocity tests. This calculation method allows heavy storm events or downpours with high measured concentrations to have a greater weight in the calculated removal efficiency curve.

Measurement results

Successful settling velocity measurements were performed in Almere on samples from three locations: Baljuwstraat (22 samples), Sluis (17 samples) and Palembangweg (15 samples). The settling of suspended components in the storm water run-off for the three sites is comparable and consistent during the measurement period.
The calculated potential removal efficiencies are shown in Figure 2. The figure shows that with a surface load of the sedimentation facility between 0.5 and 1.0 meters per hour, the potential return for Almere is 30 to 35%. In other words: If a sedimentation facility performsoptimally according to design, up to 30 to 35 percent of the suspended elements in the rain water can be removed by the separator. For substances that are partially bound to suspended components, the potential removal efficiency will be lower because these substances are also present partly dissolved in the water.

Figure 2 - Average removal efficiency (+ level of significance: green is significant at 95% confidence level, blue at 67%) of the lamella settler in Almere, Arnhem, Schoonhoven, Krimpen a/d IJssel and Haastrecht

In practice, the calculated removal rate based on the precipitation settling velocity tests proved to be the actual upper limit of the measured practical removal rates for suspended solids. For substances that are partly bound to suspended solids, the possible achievable removal efficiency is obviously lower than for suspended solids, because only the part that is bound to the suspended solids can settle.
In a number of cases, lower removal efficiencies of the plate separators were measured than theoretically feasible. This is explained by the design and management of the relevant sedimentation facilities, for example resulting in short-circuit currents.
The achievable removal rates are markedly lower than described in international literature. The storm water in storm water systems in the Netherlands appears to be relatively difficult to settle, so international design guidelines (and expected removal rates) often do not hold true. This is probably due to too little transport capacity for the sediment in Dutch storm water sewers (due to a lack in hydraulic gradient) and the habit of fitting 'surcharged' storm water sewers, so in practice these act as sedimentation facilities for the more settle able material.

Conclusions

The potential removal efficiency of a sedimentation facility depends on the surface load and the sedimentation of the contaminants. The latter is a given, the first is a design choice.
With a surface load of 1 meter per hour, often used as nominal load in the design of a plate separator, the potential removal efficiency of a sedimentation facility for suspended substances in storm water run-off is up to 37 per cent. These removal rates prove to be substantially lower than described in international literature.
These conclusions show how risky it is to automatically accept design principles and associated removal rates for storm water sedimentation facilities based on international literature. This applies, for example, in Arnhem. An earlier check on the underlying principles, in this case the properties of the medium to be treated, would have prevented plate separators from being included in the decision trees on dealing with storm water as a 'cheap option with a reasonable removal efficiency'. After all, for a reasonable efficiency (for example, 70 per cent or more), a considerably larger facility is needed with the low settling velocities of storm water in the Netherlands.
While we in the Netherlands currently consider storm water run-off as a welcome source to complement receiving water body, a lot of research is done in Germany on techniques to treat storm water, focussing on the removal of priority substances, in which attention is mainly focussed on the removal of micro pollutants (less than 63 micrometre).
It is expected that the removal of these particles will soon be required for contaminated urban areas in Germany. If we were to consider opting for the same policy in the Netherlands, the following applies: First, examine whether the German investigations also hold true for the Dutch situation.

Jeroen Langeveld
(Partners4UrbanWater)
Erik Liefting
(Partners4UrbanWater)
Bert Palsma
(STOWA)
Arjo Hof
(City of Almere)
Henk Nijhof
(District Water Board Zuiderzeeland)

Summary

On an annual basis, storm water run-off discharged into receiving water body through storm sewers contributes to a significant pollutant load to the receiving water body. A significant part of these contaminants is bound to suspended solids. Investigation was done in recent years as part of various STOWA/RIONED projects on the composition of the rain water and the probable treatment in sedimentation facilities.

The results of these investigations are bundled in this article based on the main question: What is the settling velocity of the contaminants in the storm water from storm sewers in the Netherlands?

The measurements in the Netherlands show that the settling velocities of suspended solids in the rainwater are (very) low and also considerably lower than that stated in international literature. The hydraulic design of the sewer system and the design and management of the storm drains and the layout of the ground level are possible explanatory factors.

Future sedimentation facilities can be designed better based on the results of this research.


Literature


Langeveld J.G., Liefting H.J. and Boogaard F.C. (2012). Uncertainties of stormwater characteristics and removal rates of stormwater treatment facilities: implications for stormwater handling. Water Research, 46 (2012), 6868-6880.

Liefting H.J., Boogaard F.C., Korving J. and Langeveld J.G. (2015). Lamellenafscheiders Krimpenerwaard: resultaten praktijkonderzoek. (Krimpenerwaard plate separators: practical research results.) Partners4UrbanWater/Tauw/Witteveen+Bos commissioned by City of Capelle aan den IJssel, reference 1220194_R_150413, 14 April 2015.

Langeveld J.G., Liefting H.J. and Schilperoort, R.P.S. (2016). Almere Stormwater project. Full report. Stichting RIONED/STOWA 2016-05B
^ Back to start

STORM WATER RUN-OFF

The efficiency of sedimentation facilities

ADVERTISEMENT

International Water Week

Archive


Edition 1/2015


Edition 2/2015


Edition 1/2016

ARCHIVE

Previous editions

Knowledge journal / Edition 2 / 2016

ABOUT WATER MATTERS

The knowledge section Water Matters of H2O is an initiative of


Royal Dutch Waternetwerk
Independent knowledge networking organisation for and by Dutch water professionals.


Water Matters is supported by

ARCADIS
Global natural and built asset design and consultancy firm working to deliver sustainable outcomes through the application of design, consultancy, engineering, project and management services.


Deltares
Independent institute for applied research in the field of water, subsurface and infrastructure. Throughout the world, we work on smart solutions, innovations and applications for people, environment and society.


KWR Watercycle Research Institute
Institute that assists society in optimally organising and using the water cycle by creating knowledge through research; building bridges between science, business and society; promoting societal innovation by applying knowledge.


Royal HaskoningDHV
Independent international engineering and project management consultancy that contributes to a sustainable environment in cooperation with clients and partners.


Foundation for Applied Water Research (STOWA)
Knowledge centre of the regional water managers (mostly the Water Boards) in the Netherlands. Its mission is to develop, collect, distribute and implement applied knowledge, which the water managers need in order to adequately carry out the tasks that their work supports.


Netherlands Water Partnership
United Dutch Water Expertise. A network of 200 Dutch Water Organisations (public and private). One stop shop for water solutions, from watertechnology to coastal engineering, from sensor technology to integrated water solutions for urban deltas.


Wageningen University Research
Research institute that contributes by qualified and independent research to the realisation of a high quality and sustainable green living environment.

ABOUT WATER MATTERS