CONTENTS

Knowledge journal / Edition 2 / 2020

PREFACE

Research with a view to practical application

You have before you the 11th edition of Water Matters, the knowledge edition of the Dutch journal for water professionals, H2O. You will find ten articles on a wide range of subjects, written by water professionals based on thorough research.

During the review, the editorial board made a selection that looked at a clear relationship with daily practice in the water sector, the purpose of Water Matters. Research, results and findings must be new and generate articles that provide new knowledge, insights and techniques with a view to practical application.

This edition covers a wide range of topics, including topical issues such as early detection of the coronavirus through sewage water analysis and the underlying research behind the new PFAS standards in the Netherlands. Furthermore: the influence of nitrogen and phosphorus on ecological water quality, arsenic removal in groundwater treatment, the ecological role of salt marshes for fish, the involvement of micro-organisms in drinking water production, monitoring of fish in large rivers with environmental DNA, morphodynamic effects of longitudinal training dams, the function of salt marshes for fish and the relationship between water quality and greenhouse gas emissions.

Water Matters is, just like H2O, an initiative of the Royal Dutch Water Network (KNW), the independent knowledge network for and by Dutch water professionals. KNW members receive Water Matters twice a year as an appendix to their H2O journal.

The publication of Water Matters is made possible by leading players in the Dutch water sector. These Founding Partners are ARCADIS, Deltares, KWR Water Research Institute, Royal HaskoningDHV and Stichting Toegepast Onderzoek Waterbeheer (STOWA). With the publication of Water Matters, the participating institutions want to make new, applicable water knowledge accessible.

You can also read Water Matters digitally on H2O-online (www.h2owaternetwerk.nl). In addition, this publication is also available as a digital magazine in English via the same website or via www.h2o-watermatters.com.

The English-language articles can be shared from the digital magazine on H2O-online. Articles from previous editions can also be found on the site.

Enjoy reading this edition. Would you like to react? Please let us know via redactie@h2o-media.nl

Monique Bekkenutte Publisher (Royal Dutch Network)
Huib de Vriend Chairman editorial board Water Matters

PREFACE

Presenting: Water Matters!

Knowledge journal / Edition 2 / 2020

Early detection of COVID-19 in the population through sewage water analysis

Early on in the first wave of COVID-19 sewage water proved to be an important source of information on the novel coronavirus. In recent months, numerous agencies and researchers have been working hard to establish a study design for the entire country, and to ensure that data are correctly interpreted. Reliable early warning at the level of neighbourhoods and, for example, nursing homes is within reach.

To effectively combat the novel coronavirus epidemic, we need to be able to see where the number of infections is rising as early as possible. This is the reason that the GGDs (municipal health centres) set up the well-known test centres. However, a large proportion of those who are infected do not have any or only mild symptoms and do not take a test. Everyone, however, has to use the toilet, and 40% to 50% of people who have COVID-19 excrete high concentrations of the virus in their stools.

Sensitive

Although the virus that arrives at a sewage treatment facility via the sewer system is no longer infectious, the hereditary material of the virus (RNA) can still be detected. In our study this spring, we showed that the first wave of the pandemic in the Netherlands was visible in the sewage water of several cities (Medema et al., 2020a). It also showed that when more people tested positive for COVID-19, the concentration of viral RNA in the sewage water was higher.
The analyses also proved to be very sensitive. We had already observed viral RNA in the sewers when only one COVID-19 case per 100,000 inhabitants had been reported. However, very few people were tested during the first wave, so COVID-19 was underreported. Sanquin's survey of blood donors in April 2020 also showed that there had been far more infections than reported. Now we think that the sensitivity of testing sewage is around one COVID-19 case per 5,000 to 20,000 inhabitants; still very sensitive.

Rapid

Even more important than sensitivity is speed. During the first wave, the trends in virus circulation showed themselves earlier in sewage water data than in the test results from the GGD. Firstly, this is because virus excretion can be high even before someone gets sick. Secondly, there is a delay in GGD testing. It takes several days for people to be tested and the test results to be known.
Therefore, the value of sewage measurements lies in providing an early warning. For instance, during the first wave we found viral RNA in the sewage water of Amersfoort and Terschelling six days before the first COVID-19 cases were reported.

Early warning for the whole of the Netherlands

From the spring onwards, our National Institute of Public Health and the Environment (RIVM) also measured sewage at several locations (Lodder & de Roda Husman, 2020). This has been scaled up over the past few months from twenty-nine sewage treatment facilities in May to eighty in July, to all 318 in September. Now, measurements take place at every sewage treatment facility in the Netherlands on a weekly basis (visit: coronadashboard.rijksoverheid.nl). This kind of research is also being carried out elsewhere in Europe and beyond (Medema et al., 2020b), but nowhere so early and extensively as in the Netherlands. To help ensure the comparability of results within Europe, KWR Water Research Institute and the Joint Research Centre of the European Union are carrying out a comparative study.
In the Netherlands, KWR is now only investigating sewage water in Amsterdam, Rotterdam and Utrecht - parallel to the national measurement programme. In these cities, our results announced the arrival of the current second wave (see the graphs).

Figure 1. The concentration of SARS-CoV-2 RNA at the Amsterdam-West sewage treatment facility, as compared to the number of new COVID-19 reports and hospital admissions per 100,000 inhabitants of Amsterdam.

Diligent

For reliable early warning, it is necessary to look carefully at both the sewage data and the data from regular testing (GGD). For instance, initially we reported the concentration of viral RNA in sewage water. But this concentration also depends, of course, on the dilution of domestic wastewater with other water flows into the sewer system (rainwater, groundwater, industrial wastewater, dewatering of construction sites, etcetera). This dilution varies from place to place and from moment to moment. To correct for this, we have developed a method for determining the dilution of stools in sewage water. To this end, we measure the concentration of a bacterial virus that occurs in high (and known) concentrations in all human faeces (i.e. Cross Assembly of CrAss phage). These data allow for a better interpretation of viral RNA measurements (Figure 1 and 2).
In addition, Jeroen Langeveld of Partners4UrbanWater has developed a method to correct the measurements for the number of people in the supply area of a sewage treatment facility, the volume of wastewater per person and the flow and conductivity of the sewage water. At this time we are comparing these two correction methods (Rotterdam research project, see below).

Figure 2. Concentration of SARS-CoV-2 RNA at the Utrecht Sewage treatment facility (orange), as compared to the number of new COVID-19 reports (blue) and hospital admissions (grey) per 100,000 inhabitants of Utrecht.

Influence of testing policy on data

During the first wave only people who had a specific set of symptoms were tested with the PCR test. Now, in the second wave, people are tested far more widely. This means that the ratio of the occurrence of COVID-19 according to GGD-data and the concentration of viral RNA in sewers changed between the first and second wave. This can be clearly seen comparing the first and second wave in Figures 1 and 2. At the beginning of October, the Municipal Health Service (GGD) reported about sixty COVID-19 cases per 100,000 inhabitants in both Amsterdam and Utrecht, compared to about five cases per 100,000 inhabitants during the first wave. However, the concentration of viral RNA in the sewers was similar during both periods (comparing early April with early October). Therefore, both the sewage data and the COVID-19 reports need to be normalised in order to compare them properly. Also in terms of area, a good overlap between GGD data and sewerage data is required. Areas that drain into sewage treatment facilities often do not correspond well with the areas covered by the COVID-19 reports. Remedying this will require a zip code match: which zip code areas are measured with a sewage water measurement and how many people does that constitute? And of these people, what portion has COVID-19?
Finally, our research as well as international research shows that performing measurements once a week is probably not enough to provide a reliable early warning. From that perspective, the early detection in Amersfoort and Terschelling were ‘lucky shots’. More frequent measurements are needed and also from more sites throughout larger cities to see where in the city COVID-19 resurges.

Working toward better early detection

Just before the second wave, the 'Rotterdam Sewage Project' was launched, in which some twenty institutions are collaborating. For this project, city districts and neighbourhoods have been selected where sewerage areas and general practitioners' practices do overlap. The sewage treatment facility in Dokhaven takes in sewage from four parts of the city, in streams that are sampled separately. In addition, sampling cabinets have been installed at several sewage pumping stations. We are collecting the following data:
• sewage water measurements, three times per week;
• GPs are testing patients to determine how often people diagnosed with COVID-19 have the virus in their stools;
• GPs are recording the symptoms of their patients (syndrome surveillance);
• GGD test results for the areas selected;
• viral RNA in sewage water and in patients.
The data are currently being collected and combined. What is clear is that the second wave of the coronavirus arrived earlier in some Rotterdam neighbourhoods than in others. So just like during the first wave, also now and at closer inspection, sewage water proves to provide an early warning.

More information from sewage water

The application of sewage water analysis to COVID-19 has added a new dimension to the approach to sewage water as an information source. Previously, data were collected on the use of drugs and medications, the occurrence of antibiotic resistance and, recently, the exposure of the population of Flint, Michigan to lead (Flint Water Crisis). Public health was the reason for the introduction of sewerage and sanitation, over a century ago. Now, sewage water proves to contain a great deal of information that is very valuable to public health.

Gertjan Medema
(KWR Water Research Institute)
Frederic Been
(KWR Water Research Institute)
Leo Heijnen
(KWR Water Research Institute)

Accountability

In The Rotterdam Sewer Water Project, ErasmusMC (departments of Viroscience, Family Medicine, Medical Computer Science, Medical Microbiology and Infectious Diseases), GGD, Rijnmond Gezond GP practices and RIVM work closely together with KWR, water boards, the municipality, STOWA, Partners4UrbanWater and Royal Haskoning DHV, with support from IMD and AQUON. Funding has been provided by the Erasmus MC foundation, Adessium Foundation, a Horizon 2020 grant from VEO, STOWA, the water boards and the Top Consortium of Water Technology for Knowledge and Innovation of the Ministry of Economic Affairs and Climate.

Summary

Sewage has proven to be a source of information valuable in combatting the coronavirus. The added value is mainly the early and sensitive detection of the surge or resurgence of the number of viral infections in a supply area. This is now being applied by the RIVM in the national sewage monitoring programme. The Netherlands is a forerunner in the use of sewage water as a source of information. For optimal early detection, tests should be carried out not only more often but also at more locations. Current research is focusing on collecting data about city districts at sewage pumping stations, as is happening now in Rotterdam.


Sources


Medema G, Heijnen L, Elsinga G, Italiaander R, Brouwer A. Presence of SARS-Coronavirus-2 RNA in Sewage and Correlation with Reported COVID-19 Prevalence in the Early Stage of the Epidemic in the Netherlands. Environ Sci Technol Lett 2020, 7.

https://www.sanquin.nl/over-sanquin/nieuws/2020/04/sanquin-ongeveer-3-van-donors-heeft-corona-antistoffen

Izquierdo Lara RW, Elsinga G, Heijnen L, Oude Munnink B, Schapendonk CME, Nieuwenhuijse D, Kon M, Lu, L, Aarestrup FM, Lycett S, Medema G, Koopmans MPG, de Graaf M. Monitoring SARS-CoV-2 circulation and diversity through community wastewater sequencing. https://www.medrxiv.org/content/10.1101/2020.09.21.20198838

Lodder W, de Roda Husman AM. SARS-CoV-2 in wastewater: potential health risk, but also data source. Lancet Gastroenterol Hepatol 2020, 5:533–534.

Medema G, Been F, Heijnen L, Petterson S. Implementation of environmental surveillance for SARS-CoV-2 virus to support public health decisions: opportunities and challenges [published online ahead of print, 2020 Oct 1]. Curr Opin Environ Sci Health. 2020;doi:10.1016/j.coesh.2020.09.006

https://ec.europa.eu/jrc/en/science-update/sars-cov-2-surveillance-employing-sewers-eu-umbrella-study-status-update

Nieuwenhuijse DF, Oude Munnink BB, Phan MVT et al. Setting a baseline for global urban virome surveillance in sewage. Sci Rep 2020, 10:13748.

Roy S, Tang M, Edwards MA. Lead release to potable water during the Flint, Michigan water crisis as revealed by routine biosolids monitoring data. Water Res. 2019 Sep 1;160:475-483.

^ Back to start

COVID-19

Sewage water analysis

Knowledge journal / Edition 2 / 2020

The ecological significance of freshwater-saltwater transitions and an evaluation of restoration using the model study of Lake Volkerak-Zoommeer

The natural dynamics of freshwater-saltwater transitions form the foundation for ecological diversity. Due to activities such as land reclamation, dam construction and dredging works, the freshwater-saltwater transitions (estuaries) in the Dutch Delta have nearly if not entirely disappeared. This article zooms in on the South-west Delta. Since the 1990s, there has been considerable attention for the restoration of estuarine dynamics. What precisely do the ecological values of these transitions represent? Which of these values would benefit from remedial measures?

In order to determine the ecological values of freshwater-saltwater transitions, we will first examine the major processes underpinning these complex ecosystems. The confluence of river and sea creates a mixing zone with a horizontal gradient from fresh to brackish to saltwater, as well as a vertical gradient from heavier saltwater (bottom) to lighter freshwater (surface). This mixing zone can fluctuate enormously in space and time: changing per day, per tidal cycle, per season, per year and during extreme conditions such as storms or excess river discharges. Figure 1 illustrates the salinity in the South-west Delta before construction of the Delta Works. This figure clearly illustrates that, in the absence of barriers, the brackish zone can extend over a wide area from the Biesbosch to±10 km in the North Sea, depending on the tide and river discharge.

Figure 1. Reconstruction of the original salinity (in practical salinity units or ‘psu’) in extreme situations in the South-western Delta (according to data from Wolff (1973)).

Transport processes

The transitional zone not only mixes freshwater and saltwater, but also sand and clay particles. In a complex 'dance' driven by the movement of the water and the interaction of particles, most of the particles settle in a variety of sediment types. In addition to sedimentation, there is also the transport of (dissolved) substances and organic material that the river carries with it before it passes through the estuary. This primarily concerns nutrients, minerals and suspended organic matter. The brackish zone functions as a kind of immense bioreactor where organic flakes form and are digested by large amounts of bacteria, thereby making the organic material available to the food chain in the form of nutrients.

Ecological significance

Freshwater-saltwater transitions, therefore, are much more than simple mixing zones of fresh river water and saline sea water. From an ecological perspective, what makes these systems so valuable? This has to do with the rich variety of gradients, but also with the simple fact that these areas form the physical link between river and sea, thereby enabling transport processes and species migration. The ecological significance is determined by the following four aspects:
1. Diverse habitats and species: The combined dynamics of horizontal and vertical freshwater-saline gradients and of sedimentation processes (build-up and succession through sedimentation, degradation and return to pioneer stage through erosion) play a driving role in this.
2. Food for the food web: The nutrients supplied by the rivers and released during the decomposition of organic matter stimulate the production of algae ('primary production'), the staple food for the estuarine and marine food web.
3. Nursery function: A rich supply of food and specific conditions, such as protection from turbidity and rapidly warming shallow water, make estuaries an important habitat and a good location for foraging and shelter (also) for juvenile fish and shrimps, which is important for the conservation of populations that are also a food source for other species.
4. Migration corridor (swimway): A complete freshwater-saltwater transition connects marine, estuarine and freshwater habitats. This connection is vital for the survival of migratory fish species, which are reliant on different habitats throughout their life cycle.

Restoration measures

In the South-west Delta, freshwater-saltwater transitions have been primarily influenced by the construction of the Delta Works, with the exception of the Western Scheldt. Ambitions for restoring the estuarine dynamics and connectivity are reflected in several policy tracks and in the implementation agendas of the Delta Programme, the European Water Framework Directive (WFD) and the Programmatic Approach to Major Waters (PAGW). Examples of measures aimed at restoring connections are the opening of Lake Veere to shorten residence times (2004), the opening of the Haringvliet sluices (2018), the introduction of a subdued tide on Lake Grevelingen (plan preparation and possible implementation from 2026) and numerous measures aimed at making pumping stations, weirs and sluices navigable for fish, both inland and outside the dykes. Measures are also aimed at improving existing habitats or expanding habitats, for example, by constructing nature-friendly banks (inner dike waters) and creating intertidal areas by depoldering the Noordwaard in the Biesbosch, the Hedwige-Prosperpolder, the Perkpolder along the Western Schelde and the Rammegors in the Eastern Schelde. Legislation and regulations also contribute to reducing polluting discharges and improving the overall water quality.

Model study of Lake Volkerak-Zoommeer

The decision concerning the salination of Lake Volkerak-Zoommeer has been postponed. In 2017, however, a model study was carried out to research how potential water management measures could optimise a fresh-saline gradient, with a view to maximising the ecological quality. The model revolves around three central aspects. The first is the intake of saltwater from the Eastern Schelde via (new) openings in the Philipsdam and the Oesterdam. The second is the intake of freshwater from the Hollandsch Diep via the Volkerak locks. The third is the discharge to the Western Schelde via the Bathse Spuisluis (which is already partly taking place). How would the (horizontal and vertical) salinity gradients change if these ‘locks’ were opened further or not as wide?

Figure 2 shows this for two scenarios. Large freshwater inputs (left, figure 2) largely result in a slightly brackish system (psu > 0.5), whereas lower freshwater inputs are primarily strongly brackish (right, Figure 2). The bottom layer is always saltier than the top layer and may become deficit of oxygen. The modelling also shows the stratification (layer formation) near the Volkerak locks: the upper layer is brackish and the lower layer is saline. It appears that it is not possible to create a freshwater bubble (psu < 0.5) at the Volkerak locks; not even by allowing larger freshwater flows (up to 100 m3/s). A brackish zone is always present, which to the west turns into a saline zone, so there is no complete freshwater-saltwater transition. A complete gradient is created in the estuaries of the rivers Dintel and Vliet in Brabant, but this is limited to a few tens of hectares at the most.

Figure 2. Average salinity (in psu) in the simulation of two scenarios. In the overhead views, the salinity of the surface layer. Above and to the right of both overhead views the vertical salinity distribution in a longitudinal section (Tiessen & Nolte, 2018).

Evaluation

The model study shows that forging a connection between waters using permeable dams has the potential to contribute to a controlled freshwater-saltwater dynamic that is semi-natural in nature. The supply of additional freshwater not only alters the salinity gradients, but it also provides an extra supply of nutrients. Whether, and where, this might lead to more food depends on complex interactions with, for example, the light climate and grazing (algae consumption).

If we assess the effects of the measures on the four ecological aspects mentioned above, we can conclude that they help generate greater habitat diversity in the form of saline and brackish dynamic habitats (1,) but there is no indication of complete fresh-brackish-salinity zoning. There is also a potentially higher (primary) food production (2). We estimate that varying the flow rates via permeable resources does not, or only to a very limited extent, contribute to sediment transport (1), the maternity and nursery function (3) and fish migration (4), depending on the precise management and design of the permeable dams. After all, in principle, this requires a full-fledged connection with both the freshwater and saltwater zone. A permeable dam will influence and obstruct the hydrodynamics which, in the case of a fully-fledged open connection, will cause, inter alia, gradients, rapid decomposition of organic matter and sediment transport.

The restoration measures in the South-west Delta mainly benefit fish migration due to the construction of fish passageways (constructed in pumping stations) or modified lock management (Kier Haringvliet). Other current and planned measures in the South-west Delta could restore ecological water quality (in Lake Veerse and Grevelingen) and restore mud flats and salt marshes (depoldering). All in all, restoration measures aimed at the connectivity and restoration of estuarine dynamics, as compared to the four ecological aspects, only contribute to a limited extent to the restoration of freshwater-salt water transitions.

Final thoughts

Full restoration of freshwater-saltwater transitions with a return to original estuarine dynamics in the South-west Delta can only be achieved through the removal of dams in the Delta, which is not part of the current policy. For compartmentalised waters, the opportunities for improving ecological quality lie mainly in smart guidance with locks and permeable resources - as explored in the plan preparation for Lake Grevelingen - preserving and developing intertidal habitats and, last but not least, nurturing and improving the remaining open connections.

Acknowledgements

This article was made possible through research funding from the Ministry of Agriculture, Nature and Food Quality and the Directorate-General for Public Works and Water Management.

Marijn Tangelder
(Wageningen University & Research/Marine Research)
Erwin Winter
(Wageningen University & Research/Marine Research)
Arno Nolte
(Deltares)
Tom Ysebaert
(WUR/Marine Research, Royal Netherlands Institute for Sea Research (NIOZ), University of Antwerp)

Summary

Freshwater-saltwater transitions (estuaries) form dynamic, highly varied and rich ecosystems. The estuaries of the rivers Rhine, Meuse, Scheldt and Ems have in large part disappeared. The ecological value of freshwater-saltwater transitions primarily translates into the following four aspects: (1) highly diverse habitats and species, (2) food for the food web, (3) nursery and growing area and (4) the migration corridor. The restoration measures for the South-west Delta primarily focus on fish migration, water quality and habitat development, and only to a very limited extent on restoring the supporting (transport) processes. As the model study of Lake Volkerak-Zoommeer demonstrates, innovations in the management of permeable resources for compartmentalised waters does offer opportunities for ecological improvement.


References


Tangelder, M., Winter, E., Ysebaert, T. (2017) Ecology of freshwater-saltwater transitions in delta regions. Literature review and assessment of a scenario at Lake Volkerak-Zoommeer. Wageningen Marine Research, Yerseke. Report C116/17. 48 pp.

Tiessen, M. C. H. & Nolte, A. J. (2018). Verkenning zoet-zoutgradiënten in het Volkerak Zoommeer gericht op ecologische kwaliteit (Exploration of freshwater-saltwater gradients in Lake Volkerak Zoommeer, with a focus on ecological quality). Model study. Deltares, Delft. 11201168-000

Wolff, W. (1973). The estuary as a habitat. An analysis of data on the soft-bottom macrofauna of the estuarine area of the rivers Rhine, Meuse and Scheldt. PhD, State University of Leiden.

^ Back to start

FRESHWATER-SALTWATER

Ecological significance

Knowledge journal / Edition 2 / 2020

Water quality: from agricultural ditches to regional surface waters

For the European Water Framework Directive (WFD), ecological water quality is monitored in surface waters that are managed by the water boards and the national government, but not in the ditches on farms. How do the total concentrations of nitrogen (N) and phosphorus (P) in these ditches relate to those in regional surface waters? Does this differ between soil type regions? And, does the ratio of the components that together form total N and P differ? New (summertime) measurements taken of the ditches enable this comparison.

The European Water Framework Directive aims to achieve good chemical and ecological quality of all waters throughout Europe. To monitor ecological water quality, the concentrations of N and P are important parameters. Surface water quality is monitored in several (national) monitoring networks: the WFD monitoring networks, the Agricultural-specific Surface Water Monitoring Network (Meetnet Landbouw Specifiek Oppervlaktewater, MNLSO) and the Minerals Policy Monitoring Programme (Landelijk Meetnet effecten Mestbeleid, LMM). These monitoring networks have been set up for different purposes. The WFD monitoring networks have been set up to test WFD water bodies against chemical and ecological WFD standards. The MNLSO monitors the quality of regional surface waters that are mainly affected by agriculture. The water boards monitor the regional WFD water bodies and the MNLSO locations; these overlap in some cases. The LMM has been set up for the monitoring of the Nitrates Directive and focuses, among other things, on leaching and run-off of nutrients (mainly N and P) to ditches on farms.

In terms of scale, these monitoring networks are linked to each other (Figure 1). The LMM measures the direct influence from agricultural parcels. The MNLSO locations were chosen in such a way they do not contain point sources — such as a wastewater treatment plant; they are primarily fed with water from agricultural areas. The WFD water bodies are affected by both agricultural and point sources.

Figure 1. Schematic representation of monitoring networks for surface water quality: the ditches on farms of the LMM, agriculture-specific waters of the MNLSO and the regional WFD water bodies (adapted from [4]).

The WFD targets for total nitrogen (N) and phosphorus (P), important for ecological water quality, are exceeded in approximately half of the WFD water bodies [1]. According to model calculations, this is largely the result of leaching and run-off of N and P from agricultural soils, which enter the regional surface waters via the agricultural ditches [2]. Leaching and run-off primarily occurs during the winter, when there is a precipitation surplus. The different monitoring networks show that during the winter the nitrate concentrations are highest in LMM-ditches and decrease subsequently in MNLSO and WFD waters [3].

However, the ecological WFD standards are expressed in summer averages for total N and P, as they are an important determinant of the nutrient richness of the water and the realisation of a good ecological water quality. The LMM traditionally measures agricultural ditches during the winter to monitor the leaching of nutrients. Since 2017, the LMM has also measured total N and P in agricultural ditches during the summer. With these new summer data, we investigated whether the wintertime leaching of nutrients from farms is reflected in higher summer concentrations of total N and P in LMM ditches compared to the MNLSO waters and the regional WFD waters.

Comparison method

To better align with the measurement strategies of the other monitoring networks, LMM has been measuring the concentrations of total N and P in agricultural ditches since 2017, three times during the period June-September, just like the water boards in unfiltered water (Table 1). The remaining differences in measurement strategies were taken into account in the data selection. Only data for the summer months in the years 2017-2019 were selected from the monthly data collected by the water boards. From these, average values were calculated per main soil type of the region (clay, peat and sand). The loess region was not included as it hardly contains any ditches. The water boards standardly collect water samples at a depth of 30 cm; the LMM samples the uppermost ditch water. The measurements have not been corrected for this difference.

Table 1. Measurement strategies of the various monitoring networks (LMM, MNLSO and WFD)

For both the LMM and MNLSO, we also looked at the various components that together form total N and P: nitrogen in nitrate (N-NO3), ammonium (N-NH4) and organic matter and phosphorus in orthophosphate (P-PO4) and phosphorus as (in-)organically bound. Nitrite (NO2) is not included because LMM does not measure nitrite, and it occurs in very low concentrations at the MNLSO and WFD locations. For all types of water, average summer concentrations of total N and P were compared to the WFD targets for freshwater-buffered ditches (M1a ditches): 2.4 mg N/l and 0.22 mg P/l. The WFD standards are derived per body of water depending on local conditions. Using a linear mixed model, differences in total N and P and the components between the various monitoring networks, regions and years were tested, with the measurement location designated as a random factor. Because three measurement years are insufficient for determining a trend, we looked at differences between the monitoring networks and regions over three measurement years combined (Figure 2).

Figure 2. Average summer concentration (with standard error) of total nitrogen (A) and phosphorus (B) in agricultural ditches (LMM), agriculture-specific waters (MNLSO) and regional WFD waters per main soil type for the years 2017-2019. The grey lines indicate the WFD targets for total nitrogen and phosphorus of freshwater-buffered ditches.

In the clay and sand region, total N and total P in the LMM ditches (all years combined) were significantly higher than at the MNLSO and WFD locations. In the peat region, all years combined, total N and P in the LMM ditches were not significantly different from the MNLSO locations, but were higher than the WFD locations. The MNLSO and WFD locations only differed in total P in the peat and play region. It is remarkable that during the (dry) summer of 2018, very high concentrations of total N were measured in the agricultural ditches in the sand region, and not (yet) in the other regions and monitoring networks.

Results for nitrogen and phosphorus components


Figure 3. The summer average for nitrogen (A) and phosphorus (B) components of total N and P in agricultural ditches (LMM) and agriculture-specific waters (MNLSO) over the years 2017-2019 per soil type region. For the regional WFD waters, these data were not (yet) available in usable form.

For total N and P in the clay and sand region, the LMM measures higher values than the MNLSO (Figure 2). Figure 3 illustrates that this is mainly due to high concentrations of organic-N and bound-P and not due to the inorganic nutrients (nitrate, ammonium and orthophosphate). The sum of the inorganic nitrogen components of ammonium and nitrate is comparable in all regions in both monitoring networks. The concentration of orthophosphate in the MNLSO is higher in all regions than in the ditches of the LMM.

Discussion

Comparing the new measurements of the summer values for total N and P in agricultural ditches with the (summer) measurements from regional surface waters creates a more complete picture of ecological water quality in the Netherlands at the various scales. The current total concentrations of N and P in agricultural ditches appear to be much higher than the WFD targets for freshwater-buffered ditches. For the clay and sand region, summer concentrations of total N and P in agricultural ditches are, as expected, higher than in the MNSLO and WFD surface waters (Figure 2). This is mainly due to organic-N and bound-P in agricultural ditches (Figure 3) and not to inorganic nutrients.

An important difference between the agricultural ditches and the more regional water bodies is the size of the waterways. Differences in the nutrient concentrations are related to this. Due to their shallow depths, agricultural ditches warm up faster during the summer. This is advantageous for algae growth, whereby inorganic nutrients are absorbed. Due to the shallow depths, the re-suspension of (organic) sediment particles could also play an important role in agricultural ditches. In addition, biochemical and dilution processes influence nutrient concentrations in the surface water system.

In the peat region, the total N and P in the LMM ditches do not differ significantly from the MNLSO waters. Particularly in the peat region, foreign (not from the region) water is allowed to enter many polders in summer to maintain a sufficiently high water level in the ditches, resulting in a mixture of ditch water and inlet water.

We would like to emphasise that the very dry summers of late have led to exceptional circumstances. The results presented here are for the years 2017-2019 and may differ from the average situation.

During the winter, leaching processes play an important role, as there is a precipitation surplus. Nitrogen and phosphorus in agricultural ditches in the winter can, therefore, be more clearly linked to leaching than during the summer. Moreover, the direction of the flow of water and nutrients during the winter is more unambiguous, namely from the parcels via the ditches to the bigger waters. To investigate the relationship between the leaching of nutrients in the winter and the development of N and P concentrations in the summer, the summer and winter measurements of all monitoring networks should be compared. This will require additional winter measurements of total N and P in the LMM ditches.

Jonas Schepens
(Rijksinstituut voor Volksgezondheid en Milieu (RIVM), LMM)
Saskia Lukács
(Rijksinstituut voor Volksgezondheid en Milieu (RIVM), LMM)
Arno Hooijboer
(Rijksinstituut voor Volksgezondheid en Milieu (RIVM), LMM)
Annemieke van der Wal
(Rijksinstituut voor Volksgezondheid en Milieu (RIVM), LMM)
Simon Buijs
(Deltares, MNLSO)

Summary

Measuring total nitrogen and phosphorus in both regional surface waters and agricultural ditches provides a more complete picture of ecological water quality in the Netherlands. In general, the summertime concentrations of total nitrogen and phosphorus in agricultural ditches are higher than in regional surface waters. Long-term monitoring should indicate whether additional attention and actions taken to reduce the (high) concentrations of total nitrogen and phosphorus in ditch water will lead to the fulfilment of the WFD targets.


References


Duijnhoven, N. van, Linden, A. van der, et al. (2019) KRW – Toestand- en trendanalyse voor nutriënten. Deltares, rapportnr. 11203728-006.

Groenendijk, P., Boekel, E.M.P.M. van, et al. (2016). Landbouw en de KRW-opgave voor nutriënten in regionale wateren. Wageningen Environmental Research, Rapport 2749.

Fraters, B., Hooijboer, A.E.J., et al. (2016). Agricultural practice and water quality in the Netherlands: status (2012-2014) and trend (1992-2014). RIVM, Report 2016-0019.

Klein, J., Rozemeijer, J., et al. (2016, 18 februari) Toestand en trend MNLSO- en KRW-meetlocaties. https://www.helpdeskwater.nl/publish/pages/131116/presentatie_deltares_mnlso_gap_20160218.pdf.

^ Back to start

WATER QUALITY

Nitrogen and phosphorus

Knowledge journal / Edition 2 / 2020

The ecological role of salt marshes for fish

Salt marshes – or ‘schorren’ as they are called in Zeeland – are often characterised by a specific flora and fauna. Globally, they are under increasing pressure due to, for instance, land reclamation, coastal zone developments and climate change (sea level rise, rising temperatures, more extreme periods). Salt marshes minimise coastal erosion and increase the capacity for water-storage; they are also important for carbon storage and nutrient transport from land to sea. In addition, they can serve as nursery grounds for fish and shellfish. We investigated the latter function of artificial and natural salt marshes in the Oosterschelde and the Westerschelde.

Many plants that grow in salt marshes, die off at the end of the season after which the organic material ends up in the water. This provides a lot of food for benthic animals such as amphipods and bristle worms, and species living on the seabed such as opossum shrimp and amphipods. All these species are food for fish, shrimps and crabs which enter the area at high tide. At low tide, fish that remain in or on the edge of the salt marshes serve as food for birds such as waders, gulls and terns.
Land reclamation is a way of creating or restoring new salt marshes, for nature development and coastal restoration. Assigned by the Rijkswaterstaat (Directorate-General for Public Works and Water Management), we carried out research in Zeeland (SW-Netherlands) into the use of salt marshes by fish in 2019 and 2020. The focus of the study was the difference between natural and artificially constructed salt marshes.

The artificially constructed salt marshes Rammegors in the Oosterschelde (above) and Perkpolder in the Westerschelde (under). Photos by Jeroen van Dalen.

Artificially constructed salt marshes: Rammegors and Perkpolder

The former sea arm Rammegors (Sint Philipsland) was closed off from the Oosterschelde more than forty years ago by the construction of the Scheldt-Rhine canal. A brackish-fresh water nature reserve evolved. Since more and more mud flats and salt marshes disappear in the Oosterschelde as a result of ‘sand hunger’, Rijkswaterstaat reopened the Rammegors inlet in 2014, to restore the tide and thereby ‘regaining’ 145 hectares of mud flats and salt marshes.. Salt marsh plants are now developing in the area and sedimentation is taking place.
The former agricultural area Perkpolder in the Westerschelde was reclaimed within the framework of nature restoration and the nature compensation obligation due to the deepening of the Westerschelde. After the construction of a new ring dyke, the existing dyke was breached, so that 75 hectares of new estuarine nature could develop. Here, rapid sedimentation takes place. Yet the area is still too low for vegetation development, and therefore consists mainly of mud and sand.
Since the start of the measures, both the abiotic (development of sediment, morphology) and biotic developments (benthic animals, birds, vegetation) have been monitored in both areas (Walles et al. 2019a, 2019b).

A goby

Ecological roleof salt marshes for fish

Research in the Netherlands and abroad has shown that salt marshes are known to be important as nursery grounds for young fish. At Mont-Saint-Michel (France), the salt marsh is mainly used by young sea bass which are safe in the shallow water from predation by large fish. In Germany, the use of grazed and ungrazed salt marshes by fish clearly differs. On ungrazed salt marshes, more amphipods occurred, providing food to the common goby and three-spined stickleback in winter. However, not all species use it: for instance, herring and sandgoby did not (Friese et al. 2018).
Research in the ’Verdronken land van Saeftinghe’, one of the largest intertidal areas of Europe, showed that species such as sea bass, flounder and goby make use of salt marsh creeks (Hostens et al. 1996). Furthermore, in addition to management, the age of a salt marsh also appears to influence the local community. Over time, the species composition of the vegetation develops, with food availability and habitat diversity increasing. In addition the location of the salt marsh in the fresh-saltwater gradient and local water flows are also important factors.

Fish research in salt marshes

In the autumn of 2019, we started our research in the artificially constructed salt marsh Rammegors and in spring of 2020 in the natural salt marsh near Sint-Annaland (Tholen). Both are located not far from each other in the east of the Oosterschelde (figure 1), allowing a comparison between a constructed and a natural salt marsh within one sea arm. The main aim of this pilot was to investigate the best way to sample fish fauna. The methods for further study were selected on the basis of the experience in the pilot.
Field research in the salt marshes is a challenge due to the soft mud and strong currents. We used fyke nets with different mesh sizes and a seine net - measuring 25 metres long and 1 metre high - which is pulled through the water in a curve. In each gully several fyke nets were set at low tide, with the opening of the net towards both the Oosterschelde and the salt marsh. This way, fish are caught with both incoming and outgoing tide. The traps were emptied after 24 hours — two high tide cycles.
Last autumn (2020), the study was expanded to include two locations in the east of the Westerschelde: the artificially constructed salt marsh Perkpolder and the natural salt marsh the ’Verdronken land van Saeftinghe’.

Summary of fish catches in the various salt marshes in 2019 and 2020 (alphabetical order). O = Oosterschelde; W = Westerschelde; a = artificially constructed.

The catches

In the autumn of 2019, in the artificially constructed salt marsh Rammegors (Oosterschelde) we mainly caught eel in the fyke nets, sometimes about twenty to sixty individuals per trap, varying in length from 15 to 60 centimetres (table). The European green crab was also found in large numbers, about 100-200 per trap. At the mouth of wider creeks, with the seine net we caught many young fish (e.g. sand smelt). In the natural salt marsh of Sint-Annaland in the spring of 2020 only few fish were caught. The catches consisted mainly of green crabs, moon jellyfish, sea gooseberry, compass jellyfish and a large number of sand smelt. With the seine net, we caught many young mullet, common shrimp, rockpool shrimp and a few young European smelt.
In the fall of 2020, in the Westerschelde we caught many large fish in fyke nets such as adult seabass and flounder. We suspect that also adult mullets make use of the creeks in the ‘Verdronken land van Saeftinghe’. We did not catch them but saw grazing tracks on the seafloor at low tide. With the seine net, we caught small species such as young mullet, goby, rockpool shrimp and common shrimp.
The large differences between the Oosterschelde and Westerschelde were expected. Based on the data from our annual survey in the channels of these sea arms, we already knew that the Westerschelde harbours more and larger fish .

Artificially constructed salt marshes

Salt marshes in the delta fulfil various ecological roles for fish: nursery grounds for e.g. mullet, sand eel and goby, and a foraging area for larger fish such as sea bass and adult mullet. From our study we conclude that the location and the development phase of artificially constructed salt marshes seem to be important for its potential role as living, hiding or feeding area for fish. For instance, the salt marsh Rammegors in the Oosterschelde is well vegetated, providing protection for young fish. The salt marsh Perkpolder in the Westerschelde consists mainly of mud and is drained entirely at low tide. Fish therefore swim in and out of the creeks with the tide and mainly use the area for foraging, probably targeting zooplankton and juvenile fish. However, at low tide juvenile gobies are left behind in the few small pools, indicating that this species may use the area as a nursery ground. The results in Rammegors and Perkpolder indicate that (young) fish quickly manage to utilize these salt marshes, even though the areas are still developing.
The results of our fish research suplement the monitoring of benthic animals and birds in these salt marshes. We now have a better picture of the total biodiversity and how it develops over time after the re-development of the area. To further our understanding, more frequent sampling during the season will be necessary in order to better compare the functioning of the natural and artificially constructed salt marshes in the Oosterschelde and Westerschelde. For example, some species only use salt marshes at certain times of the year.
More frequent catching will also enable us to follow the growth of fish species. Diet studies (e.g. of stomach content) can shed light on the functioning of salt marsh systems and on the influence of the management on the fish that utilize the area. We hope to further expand this fish research during the next few years.

Ingeborg Mulder
(Wageningen Marine Research)
Ingrid Tulp
(Wageningen Marine Research)

Background picture:
Jetze van Zwol, Jack Perdon and Daan van Houte next to a newly placed fyke net (2020). Photo by Ingeborg Mulder.


Summary

Fish research was carried out in 2019 and 2020 in natural and artificially constructed salt marshes in the Oosterschelde and Westerschelde, to determine which fish were present and what ecological role the salt marshes fulfill for the various species. Salt marshes are rich in food for many animals. It is clear that juvenile fish soon manage to utilize the artificially constructed salt marshes as a nursery area and find suitable habitat and food. Large fish mainly seem to use the areas to forage.


Literature


Friese, J., A. Temming and A. Danhardt (2018). Grazing management affects fish diets in a Wadden Sea salt marsh. Estuarine Coastal and Shelf Science 212: 341-352.

Garbutt, A. & M. Wolters. 2008. The natural regeneration of salt marsh on formerly reclaimed land. Applied Vegetation Science 11: 335–344

Hostens, K., J. Mees, B. Beyst and A. Cattrijsse (1996) Het vis- en garnaalbestand in de Westerschelde: soortensamenstelling, ruimtelijk verspreiding en seizoenaliteit (periode 1988-1992). (The fish and prawn population in the Westerschelde: species composition, spatial distribution and seasonality (period 1988-1992). Ghent: Ghent University.

Walles, B., E. Brummelhuis, J. van der Pool and T. Ysebaert (2019a) Development of the benthic macrofauna community after tidal restoration at Rammegors. Wageningen Marine Research, report C042/19.

Walles, B., E. Brummelhuis, J. van de Pool, L. Wiesebron and T. Ysebaert (2019b) Development of benthos and birds in an intertidal area created for coastal defence (Scheldt estuary, the Netherlands). Wageningen Marine Research, report C043/19.

^ Back to start

SALT MARSHES

Nursery grounds for fish

Knowledge journal / Edition 2 / 2020

Morphodynamic effects of longitudinal training dams in the river Waal

During an extensive pilot study in the river Waal, research was carried out into the effects of longitudinal training dams with the accompanying side channels on flow patterns, morphology and their management.

Our large rivers have largely been normalised, which means that the main channel has been reduced to a constant width. This has been realised by the construction of groynes. Longitudinal training dams (LTDs) with accompanying side channels form an innovative application of the normalisation system in the summer bed of the river.
The aim of such LTDs is to reduce as much as possible problems in the river network with a system change. This concerns all the functions and interests: not only liveability and safety problems related to high water levels, biodiversity, water management and low water levels, but also for goods transport, recreation in the floodplains, pleasure cruising and sport fishing.
For research into this system change, a pilot was set up in 2015 by Rijkswaterstaat Eastern Netherlands (the East-Netherlands Public Works and Water Management), over a length of ten kilometres in the river Waal near Tiel. This pilot was monitored extensively. To be able to use LTDs as effectively as possible, attention was also paid to the influencing of dynamic equilibrium which the system tends towards. For this purpose, the setting range for managing various parameters is an important means.
We will discuss in particular morphodynamic effects of LTDs: (1) Knowledge development about the dominant physical processes for flow and sediment dynamics in the vicinity of the inflow of a shore channel and (2) Developing handles for managing this. This research draws upon analysis of data from field measurements and from a physical scale experiment at Wageningen University & Research, in collaboration with Rijkswaterstaat Eastern Netherlands. In addition, within the RiverCare research programme and the public-private collaboration WaalSamen (WaalTogether), a wide range of effects of LTDs was studied, including social support, ecological effects and consequences for the shipping sector and the landscape experience.

Flow patterns

At the site where the river splits into a main channel and shore channel, there is a sill. This can be seen as an extended but lowered part of the LTDs and is described as submerged broad-crested weir, whereby both upper and lower flowing hydraulic conditions influence the discharge distribution and the flow pattern. In the river Waal, the flow patterns have been monitored extensively.
The sill at the side channel intake leads to a complex three-dimensional flow pattern. In order to make the side channel suitable for recreational boating for instance, insight into this flow is necessary. Behind the sill a vertical circulation occurs, caused by a blockade of the flow by the sill in the bottom layer of the water column. In addition, the geometric design of the barrier influences the angle under which water flows into the shore side channel, and therefore also the size of the horizontal recirculation cell which occurs along the top head of the LTD longitudinal dam in the side channel (see figure 1).

Figure 1. Schematic view of the flow patterns around the inflow opening of the side channel. I) The inflow angle increases with decreasing longitudinal and transverse distance to the longitudinal dam head. II) The barrier blocks the flow in the bottom part of the water column. III) The geometry of the barrier induces a vertical rotation, whereby vrot represents the component of the flow which deviates to the right compared to the depth average flow. IV) Along the longitudinal dam, a horizontal recirculation cell emerges.

Management of the water and sediment distribution

The fraction of the total river discharge that enters the side channel increases with an increasing flow cross-sectional area over the barrier. This is particularly important for being able to manage the flow discharge distribution over the main channel and side channel. As an illustration: in the initial design of one of the LTDs, the side channel appeared to carry a too large part of the total discharge. Reduction in Flow cross-sectional area over the sill has resolved this problem.
The sediment import to the side channel is managed by the design of the sill. This is mainly visible in the morphological structures which form at the beginning of the side channel, and in intensity depending on the geometric design of the sill. Three morphological structures characterise the upstream end of the side channel, as studied in a physical scale model (figure 2):
1. Bank erosion in the shore channel, although this is not as prominently visible in the river as it was in the scale experiments in the laboratory. Remains of old groynes could stabilise the bank.
2. A bar as a result of divergence of the flow into the side channel. However, this morphological effect has no significant consequences for the function of theLTDs, as long as recreational boaters are guided via the most suitable route (just downstream) through the opening.
3. A bar on the side channel side of the longitudinal dam head. This will only cause a nuisance in the event of low water levels.

Figure 2. Schematic view of the project area in the river Waal, and the three morphological characteristics upstream in the side channel: 1) bank erosion, 2) sedimentation as a result of flow divergence, and 3) sedimentation against the longitudinal dam head (source of background figure: Eerden et al. (2011).

In order to increase the setting range of LTDs, a few other interim openings were created as a connection between the main and the side channel (see box), apart from the main upstream entrance of the side channel. By enlarging these, in various places along the length of the LTD, water and sediment are exchanged between the main and side channel. In order to establish what influence opening these interim openings has on the water and sediment distribution, more research is needed.

Bed forms and morphology

LTDs are not a local measure, but an adaptation of the normalisation system in the summer bed. This is also reflected in the effect on bed forms in the main channel of the river, where LTDs influence the spatial pattern of bars (length scale 1 km). However, the length and height of river dunes (length scale 100 m) remain unaltered, for instance. In any case, this results in no strong bed-form related shallow areas occurring, shallows (which are negative for shipping) do not evolve.
In addition, as a result of removing the groynes in the inner bend, the strong morphological effect around groynes disappeared, which ensures a more even bed on the edge of the waterway and a flow that is more aligned with the river axis. Long-term monitoring should indicate whether the LTDs prevent soil subsidence in the river, but the first results do indeed point in that direction.
The shipping sector also benefits from LTDs in a different way. During periods of a low water level, the effective width of the river is limited, because water virtually only flows through the main channel and ships can approach the longitudinal dam closer than the heads of the originally present groynes. This leads to a rise in the water depth. A possible disadvantage for the shipping sector is the reduced width of the waterway during low water levels. However, because ships can navigate lose to a longitudinal dam (other than in the case of the groynes) and the longitudinal dam lies outside the waterway, the effect on the shipping sector is limited.
In the case of high water levels, the shore channel flows to an increasing extent. The streamlined shape of the dam results in a larger discharge capacity and therefore a water level decrease. This is beneficial for flood safety safety.

Ecology

Another effect of LTDs is the positive ecological development in the side channel. A comparison of sampled species in the side channel and in the traditional groyne fields shows a considerable difference in the advantage of the side channel. Even over the limited number of years since delivery of the bare side channels, indigenous fish, shellfish and insect larvae have increased considerably both in number of species and individuals. This is thanks to various factors, including protection from shipping noise and shipping waves. The waves lead lead to a particularly unfavourable habitat for many species in groyne fields.
It has appeared that flow up to the sill is well described by a potential flow model, in which the roughness of the bed does not play a role. With this fact as a starting point, more experiments are possible in order to give extra stimulus to the ecological development in the shore channel. If the effects on the flow also appear minimal during a field study, this could bring about habitat enrichment.
A positive ecological development of the shore zone can make a positive contribution to the experience of the landscape. For the design of the LTDs, natural sightlines and landscape characteristics were taken into account as much as possible. This and the repeating groyne pattern on the opposite bank ensure that the river continues to fulfil its landscape function, despite the experience partly changing.

Conclusion

The setting range of longitudinal dams on the discharge and sediment distribution between the main channel and shore channel for water levels under the crest of the longitudinal dam is considerable. The system change, for which tests have now been carried out with a prototype, has the potential of influencing the bed morphology on a larger spatial scale. Together with the positive effects of longitudinal dams on, for instance, ecology, the shipping sector, low water levels and flood safety, this means that the system of longitudinal dams and shore channels forms a valuable addition to the range of river management measurements. However, for the application of longitudinal dams in other rivers, with other characteristics and hydraulic preconditions, extensive integral research will be needed.

Timo V. de Ruijsscher
(Wageningen University; Rijkswaterstaat)
Suleyman Naqshband
(Wageningen University)
Bart Vermeulen
(Wageningen University)
A.J.F. (Ton) Hoitink
(Wageningen University)

Background picture:
The most downstream longitudinal dam in the river Waal (near Ophemert), viewed in an upstream direction (source: Rijkswaterstaat Oost-Nederland, 2015).


What is a longitudinal training dam?

A longitudinal training dam (LTD) is a solid structure in a river, intended as an adjustment to the normalisation system in the summer bed. The aim is to take groynes away from the main channel and to separate the river into two parallel longitudinal channels, by means of a LTD. A longitudinal dam in a river separates the main channel from a side channel, which is always positioned in the inner bend. During periods of high water, the whole longitudinal dam is submerged, which is the case for approximately one hundred days per year for the prototype of the pilot in the river Waal. The main channel and side channel are, apart from upstream and downstream, also connected by interim openings (underwater dams of rip-rap in one or more places over the length of the LTD, which can be opened to a more or lesser extent. In the current pilot, all the interim openings are completely closed. Depending on the future river discharges and wishes from integral river management, this could change.

Summary

Longitudinal dams with accompanying shore channels form an innovative application of the normalisation system in the summer bed of the river. During an extensive pilot study in the river Waal, research was carried out into the effects on flow patterns, morphology and their management. This was researched with a combination of an extensive measuring campaign in the river Waal and physical scale experiments at the WUR (Wageningen University & Research). The results show a complex flow pattern for the inflow into the side channel behind the longitudinal dam, but also a large setting range for the water and sediment balance. Important advantages are also obtained for the shipping sector, as a result of an increase in the depth during periods with a low water level, and for the ecological value of the area, which is increasing behind the longitudinal dam.


References


Van Aalderen, R., F. Bosman, F.P.L. Collas, H. Eerden, R. Engel, H. Heerdt, A.J.F. Hoitink, R.S.E.W. Leuven, L. van Toorenburg, C.F. van der Mark, E. Mosselman, F. de Visser & L.N.H. Verbrugge (editor) (2019). WaalSamen: Working together for sustainable living with water. Enschede: University of Twente. https://research.utwente.nl/en/publications/waalsamen-working-together-for-sustainable-living-with-water.

Eerden, H., E. van Riel, R. de Koning, E. Zemlak & N. Aziz (2011). Integraal ontwerp pilot langsdammen Waal. (Integral design of pilot longitudinal dams for the river Waal.) Rijkswaterstaat Oost-Nederland, Arnhem.

De Ruijsscher, T.V. (2020). Aligned with the flow – morphodynamics in a river trained by longitudinal dams. PhD thesis, Wageningen University. doi:10.18174/503236.

^ Back to start

MORPHODYNAMIC EFFECTS

Longitudinal training dams

Knowledge journal / Edition 2 / 2020

Underlying research behind the PFAS standards for reuse of soils and sediments

There was considerable social unrest regarding significant restrictions in the recycling of soil and dredged material due to the presence of perfluoroalkyl and polyfluoroalkyl substances (PFAS). The temporary operational framework of July 2019 did not offer a sufficient solution. Incrementally (November 2019, July 2020), standards were further elaborated, so that recycling is now largely possible again. Under considerable timepressure, RIVM (the National Institute of Public Health and the Environment) and Deltares have derived limit values in order to enable this. This article is about the underlying studies and analyses behind the new PFAS standards.

Applying soil and dredged material in surface water has been regulated in the Decree and Regulations on soil quality (Soil Decree). This decree is especially aimed at a fast and routine test to determine whether the reuse of soil and dredged material is environmentally acceptable and whether there is a question of deterioration in the (water) soil quality. The routine character is expressed in a recorded substance list and generic standards, for instance.
PFAS, a collective name for more than 6,000 substances in which, for instance, a combination of fluor compounds and alkyl groups occur, did not appear on the substance list, while perfluorooctane sulfonic acid (PFOS) had meanwhile become a priority substance in the Water Framework Directive (Kaderrichtlijn Water). The Soil Decree does not provide a simple option for adding new substances. However, a duty of care does apply, also in situations where no specific statutory regulation has been violated. After a few incidents (Schiphol, Chemours), more research was carried out into PFAS. This showed that these substances did not occur incidentally, but were dispersed.
Based on the duty of care, it was therefore argued that it would only be possible to recycle soil and dredged material if they could be shown not to contain any PFAS. A decree with considerable consequences, the soil removal and dredging activities stagnated. In order to fulfil the duty of care, in July 2019 the first version of the Temporary operational framework PFAS was published. Due to a lack of knowledge, the determination limit (0.1 µg/kg) remained the upper limit for most applications in surface water. The stagnation was not resolved with this.
For this reason, the Temporary operational framework was amended incrementally in November 2019 and in July 2020. In this way, on the basis of additional research and policy development, a responsible expansion of the application standards was worked on. This article describes the studies which were used as substantiation for the applications: 1. The new background value (AW) soil (Wintersen et al., 2020a), 2. A recontamination level (herverontreinigingsniveau (HVN)) in the large national waters (Osté et al., 2019), 3. An HVN in regional waters (Osté, 2020) and 4. The differences in the leaching of PFAS from soil and dredged material (Wintersen et al., 2020b).

Background value soil

Once it was known that PFAS were diffusely distributed in all soiland sediments in the Netherlands, it was therefore clear that background values had to be established for this group of substances, as had been carried out in the past for other diffuse substances in the soil (Lamé et al. 2004). In order to obtain these values available as soon as possible, the unconventional step was taken to determine temporary background values on the basis of data available up until then.
In this way, it was already possible in late 2019 to determine provisional or temporary background values for two PFA compounds, namely PFOS and PFOA (0.9 and 0.8 µg/kg). Because it cannot be ruled out that the samples supplied were contaminated, the decision was made not to determine the temporary background values with the customary 95th-percentile value (P95 1) of concentrations, but with a cautious P80.
In mid-2020, the final background values were published on the basis of a new soil survey covering the entire country (Wintersen et al., 2020a). Since this survey was exclusively carried out at carefully selected agricultural and nature locations, this time the P95 could be used. This ensured an expansion compared with the temporary background values for PFOS and PFOA (1.4 and 1.9 µg/kg). Furthermore, it appeared that no other (of the thirty analysed) PFAS compounds were found structurally in the soil.
In 2007, it was decided that the background value for soil (the ‘always clean’ limit) also applied to sediments. Generally, the background value is lower than the recontamination level (HVN), but for PFOA this did not appear to be the case. This is why the background value for soil for PFAS were pronounced not applicable to the water bed.

Recontamination (HVN) of national waters

Since the standstill principle is an important pillar of the Decree on soil quality, the HVN Rhine catchment plays a vital role. It was pronounced applicable to the whole of the Netherlands, so also in the regional waters and in the other Dutch river basins. The HVN Rhine catchment is calculated by determining the 95th percentile of ten years of suspended particulate matter quality at the Lobith measurement station, where the Rhine enters our country. However, PFAS were not measured in suspended particulate matter. When the debate about PFAS occurred, RWS added PFAS (thirty substances) at twenty monitoring locations in the national waters to the list of compounds.
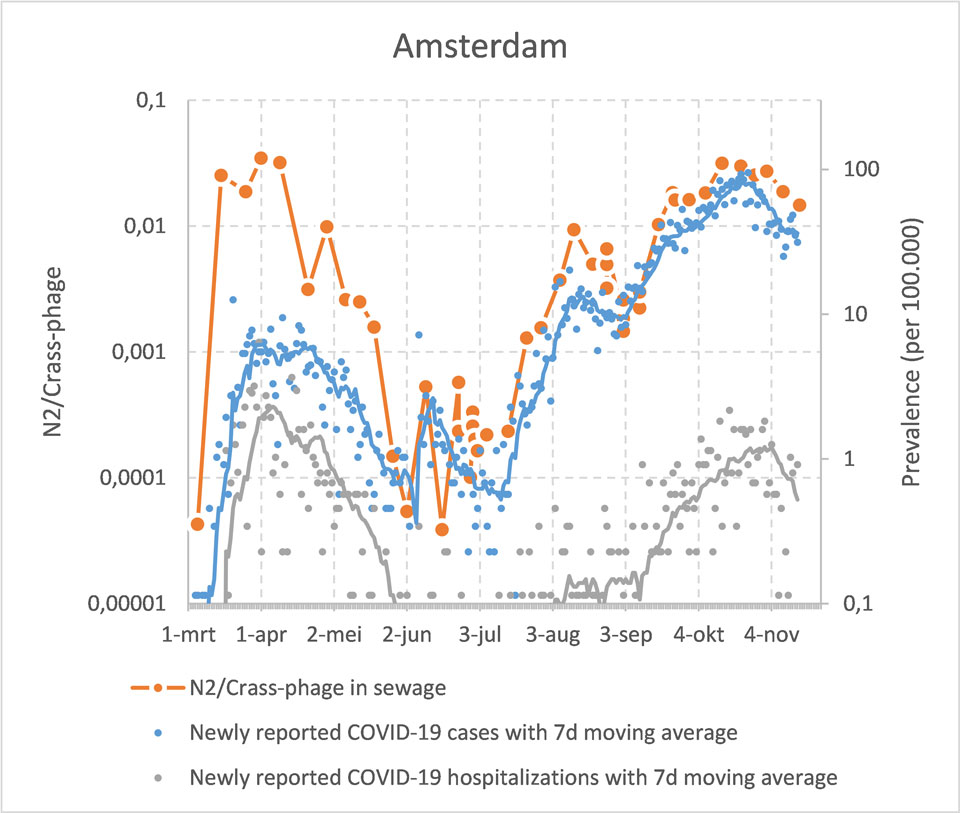
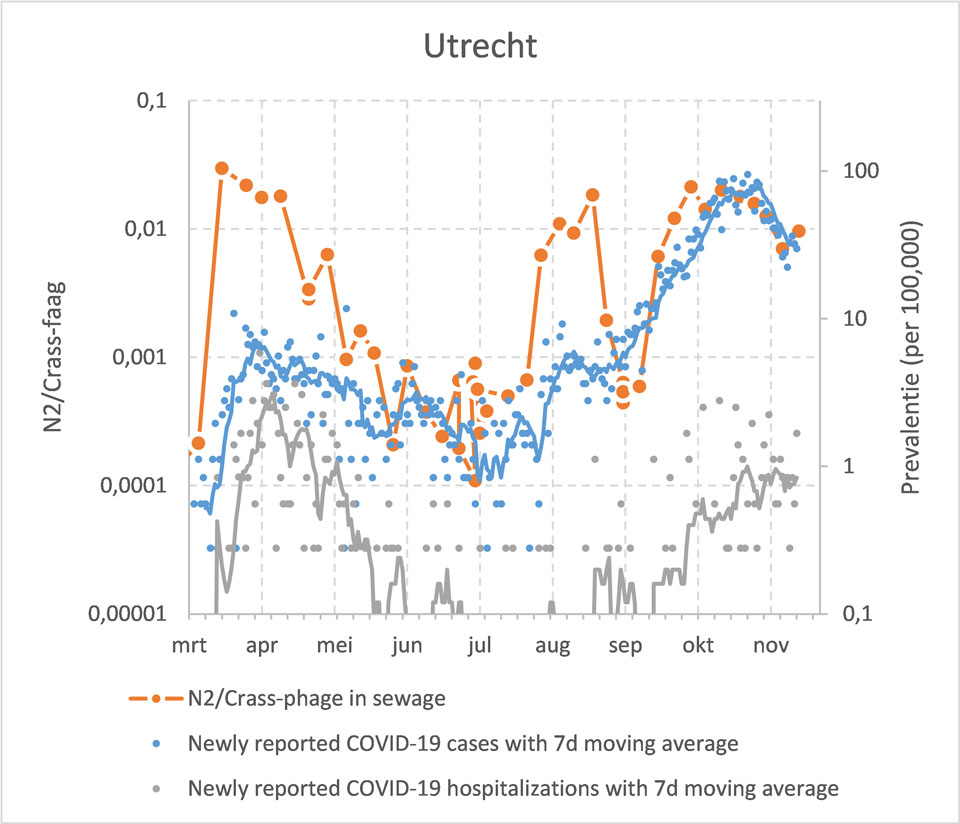
The temporary HVN national waters for PFAS were determined on the basis of these measurements. An 80th percentile was chosen, as a ten-year series was not available, comparable with the percentile that had been chosen for the temporary background values soil. For PFOS that rule was deviated from because, from the historical measurements, it appeared that a downward trend was observed (figure 1). The data used already contained relatively low levels compared with a ten-year series. The precaution of an 80th-percentile value would lead to a ‘double precaution’. This is why a 95th percentile was chosen for PFOS.
The above-mentioned methodology ultimately resulted in an HVN for PFOS of 3.7 µg/kg. In contrast to soils, also other PFAS than PFOS and PFOA were found in sediments. These PFAS compounds were all under 1 µg/kg. The highest of those ‘others’ (EtFOSAA: 0.8 µg/kg) was pronounced applicable to all other PFAS.

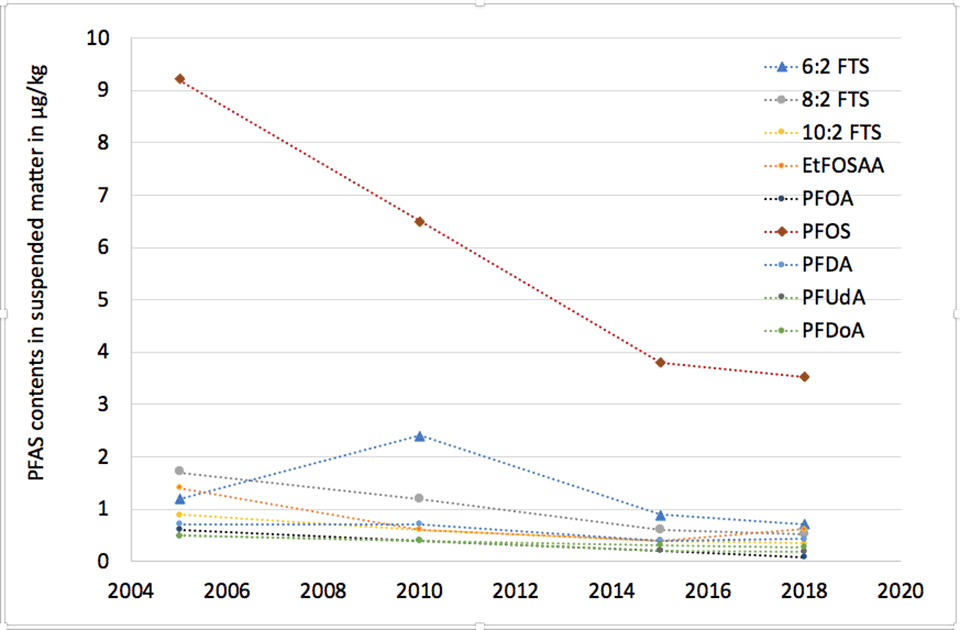
Figure 1. Trends of average PFAS levels in suspended matter in national waters

HVN regional waters

Since the implementation of the Soil Decree, the redesign of deep lakes using soils and sediments, had really taken off, also in regional waters (often not connected to other surface water). For this purpose, the maximum value class A (HVN Rhine catchment) applies as a generic standard. The question was therefore whether HVN national waters for PFAS was also suitable for lakes outside the national waters. On the basis of a database of PFAS in regional water beds, it appears that the HVN national waters is higher than the sediment quality in the regional waters.
The HVN national waters would not guarantee a standstill in regional waters and therefore, in late 2019, it was pronounced only applicable to lakes in a direct connection with the national waters where redesigned had already commenced. In order to accommodate the redesign of regional lakes already in process, in spring 2020, it was proposed to derive for this purpose an HVN for regional waters on the basis of water-bed data and not on the basis of suspended particulate matter. For various reasons, in this case an 80th percentile of all the data was also used.

Leaching of PFAS from soil and dredged material

The application of the standards for redesigning deep lakes in connection with the national waters in November 2019 was limited to with the use of dredged material. This limitation arose from the assumption that the mobility of PFAS could be different in soils, which are affected by air deposition, and wet sediment, which are exposed to direct discharges on surface water and have low-oxygen conditions.
In spring 2020, research was carried out into the leaching behaviour of PFAS. Three times, forty samples were examined of the categories soil, flood plains and water bed (dredged material). The soils were shaken for twenty-four hours in a ratio of 1 (solid ground) to 10 (liquid) in accordance with ISO 21268. The solid phase and water phase were then examined for the same PFAS compounds. From the study, it appeared for PFOS and PFOA that the extent of leaching from the soil is not greater than from sediments or flood plains (figure 2). No clear relation was found between the leaching and soil characteristics such as pH, lutum and DOC. A weak relation was found between organic matter and the leaching.

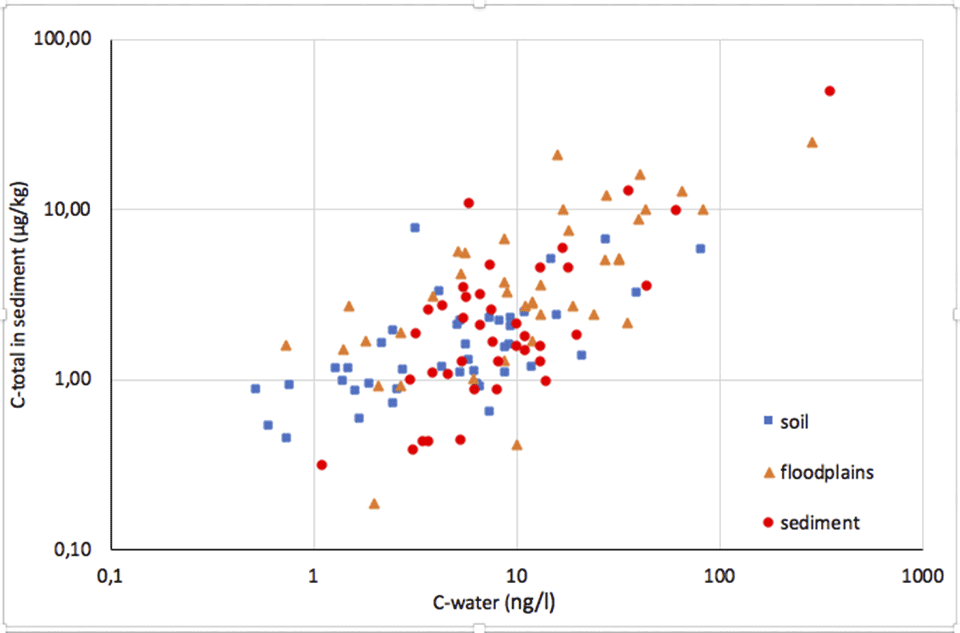
Figure 2. Relationship between PFOS in the solid phase (soil, floodplain soil and sediment) and PFOS in the liquid phase of a shaking test

Glance ahead:

The temporary operational framework of July 2020 will not be the last update. At present, an update of the HVN national waters is being worked on, because new data in suspended particulate matter was collected in 2020. A PFAS policy for dredged material that will be redistributed at sea is also being worked on. Lastly, it is being considered whether an upper limit for reuse can be applied, comparable to the maximum value class B.
In addition, PFAS has resulted in several discussions that also touch on other substances. Firstly, from the PFAS file, we can learn how we should approach new substances in the future. Furthermore, the question is whether an HVN regional waters should also apply to other substances, and the coordination of the earth removal with the Framework Directive Water requires further attention. Such discussions require time and will not be resolved within the definitive PFAS action framework.

Leonard Osté
(Deltares)
Arjen Wintersen
(RIVM)

1 In a distribution, 95% of the observations lie under the P95 value. The background values provide an indication of the top level of the concentrations that can be found in unsuspected areas. The choice for a P80 results in a lower value.

Summary

After a few incidents (Schiphol, Chemours), more research was carried out into perfluoroalkyl and polyfluoroalkyl substances (PFAS). This showed that these substances did not occur incidentally but were diffusely dispersed. However, PFAS did not appear on the substance lists of the Decree on soil quality. Based on the duty of care, it was therefore determined that soil and dredged material could only be applied if they were shown not to contain any PFAS. With the aid of temporary standards, the duty of care has gradually been elaborated within the temporary action framework, so that soil and dredged material removal is now largely possible again. This article addresses the underlying studies which were used to substantiate these standards. It concerns determining: 1. The new background value (AW) soil, 2. A recontamination level (herverontreinigingsniveau (HVN)) in the national waters, 3. An HVN in regional waters and 4. The differences in leaching PFAS from soil and dredged material. Finally, future developments concerning the standard construction for applying soil and dredged material in surface water are considered.


Literature


Lamé, F. P. J., Brus, D. J., & Nieuwenhuis, R. H. (2004). Background values 2000. Main report AW2000 phase 1.

Osté, L., I. van Tol, R. Berbee, W. Altena, 2019. Advice provisional recontamination level (HVN), PFAS for water beds for applying and distributing dredged material in surface water (Advies voorlopig herverontreinigingsniveau (HVN) PFAS voor waterbodems voor het toepassen en verspreiden van baggerspecie in oppervlaktewater). Deltares report 11203697-018-BGS-0001.

Osté, L. 2020. Recontamination of PFAS in dredged material from regional waters (Herverontreinigingsniveau PFAS in bagger uit regionale wateren). Deltares memo 11205535-006.

Wintersen, A., J. Spijker, P. van Breemen, H. van Wijnen, P. Otte 2020a. National background values soil for PFOS and PFOA (Landelijke achtergrondwaarden bodem voor PFOS en PFOA). RIVM report 2020-0100.

Wintersen, A. Osté, L., R. van der Meiracker, P. van Breemen, G. Roskam, J. Spijker, 2020b. Difference in leaching of PFAS from soil and dredged material (Verschil in uitloging van PFAS uit grond en bagger). RIVM report 2020-0102.

^ Back to start

NEW PFAS STANDARDS

Underlying research

Knowledge journal / Edition 2 / 2020

Improved arsenic removal: strategy, developments in technology and operational results

Since 2013, Brabant Water has been trying to improve the removal of arsenic during groundwater treatment to < 1 µg/l in the drinking water. Advanced Oxidation Coagulation Filtration (AOCF) with NaMnO4 dosing is efficient for removal, but it does have operational disadvantages. The Prinsenbosch water production site is looking for a better alternative.

Strategy

Arsenic (As) is a highly toxic element that naturally occurs in groundwater sources. The Netherlands observes the same standard for arsenic in drinking water as the recommendation stated in the World Health Organization guideline: < 10 µg/l. This arsenic standard, however, has been a source of debate in the Dutch drinking water sector since 2008: it is considered too high. Research has shown that the health benefits of a more extensive removal of arsenic (up to < 1 µg/l) far outweigh its costs. As a result, Brabant Water set an internal target of < 1 µg/l in 2013 and developed an Arsenic Removal Master Plan that brought together research, developments in technology and cost calculations to improve arsenic removal at six of its water treatment plants (WTPs). Meanwhile, the debate about arsenic continued, leading in 2016 to a national precautionary directive established by Vereniging van waterbedrijven in Nederland (Vewin) of < 1 µg/l.

Developments in technology

Based on the literature, Advanced Oxidation Coagulation Filtration (AOCF) is known to remove arsenic. The core of this method lies in the addition of an oxidator (NaMnO4) to oxidise As3+ to As5+ in the existing treatment of groundwater (aeration-rapid filtration). The As5+ can subsequently be removed in the rapid filters by adsorption into iron (oxide) hydroxides. Depending on the ratio of arsenic to iron contained in the groundwater, Fe(III) must also be dosed to achieve an arsenic level of < 1 µg/l. The AOCF method was initially selected and, after extensive research, implemented in 2016 at WTP Dorst (with NaMnO4 and FeCl3 dosing) and the following year at WTP Prinsenbosch (only NaMnO4 dosing).
Although arsenic was effectively removed using this method, in practice, some operational disadvantages were encountered, such as shorter filter run time, particle breakthrough and poor thickening of the backwash water sludge.

For these reasons, a study was launched in 2018 to find an alternative that would have fewer negative effects on operational aspects. This research took place at WTP Prinsenbosch, first on a pilot scale, then also on a practical scale.
As part of the pilot study, four variants were compared with each other: no dosing (i.e. the old situation, without As removal) and the dosing of NaMnO4, Fe(III) and Fe(II); respectively, in the form of FeCl2. Recent research had shown that the As3+ in the filters is biologically converted into As5+, so it might not be necessary to dose an oxidiser like NaMnO4. The hypothesis was that arsenic removal would not only be improved by the higher Fe/As ratio, but also that the Fe(II) would penetrate deeper into the filter than Fe(III). In addition, the idea was that dosing Fe(II) would provide a process comparable to traditional groundwater filtration. This is because Fe(II) is removed from groundwater with longer run times, less particle breakthrough and better thickening of backwash water sludge.

The Prinsenbosch pilot study did indeed show that dosing only Fe(II) removes As up to < 1 µg/l. The study confirmed that the Fe(II) in the filter was removed in the form of iron (hydr)oxides, to which the arsenic adsorbed. Not only was the arsenic largely removed, but the operational disadvantages of AOCF were also largely overcome. In comparison with AOCF, filter run times were significantly longer, there was no particle breakthrough and the thickening of the backwash water sludge was remarkably better (factor 3-4).
The pilot was followed by practical research, also in Prinsenbosch, in which the existing dose of NaMnO4 in one filter series was replaced by a dose of Fe(II). The results were in line with those of the pilot study.

The results of the pilot study are summarised in Table 1. The operational costs for chemicals, backwash water loss and sludge processing have been calculated for the practical installation.

Table 1. Operational results of the pilot study; operational costs (chemicals, loss of backwash water and sludge processing) converted to practical scale.

Based on the results, all three of the chemicals tested remove arsenic up to < 1µg/l. Compared to the situation without arsenic removal or dosing, the filter run time (the time after which backwash is required) is reduced in all cases. With Fe(II), however, it remains considerably longer than with Fe(III) and NaMnO4, resulting in significantly lower backwash water usage. In addition, there is no particle breakthrough and the reason for the backwash is filter resistance. The effects on filtration are also depicted in Figure 1.

Figure 1. Surface water level (a measure for the filter resistance) (m H2O, orange) and turbidity in the filtrate (NTU, blue) of the pilot installation at the four doses studied; slushing (Δp) = backwash due to too high filter resistance.

The figure shows that the filter resistance increases much faster when dosing Fe(III) and NaMnO4 than when dosing Fe(II). This is particularly noticeable in comparison with Fe(III), given that more Fe was dosed by almost a factor of two. In addition, the sensitivity of turbidity breakthrough with Fe(III) and NaMnO4 is much greater than Fe(II), as sometimes turbidity was the decisive backwash criterion, rather than resistence.

Beyond the filtration benefits, the thickening of the sludge also considerably improves with Fe(II) dosing. It is even comparable to the old situation, without dosing. Finally, the costs of dosing and sludge treatment are much lower.

The favourable effect of FeCl2 dosing on operational results can be explained by the fact that the iron (oxide) hydroxides formed with Fe(II) dosing are much more compact than the deposits formed at AOCF (Fe(III)/NaMnO4). This is likely due to the structure of the deposits formed. Based on the literature, it is known that the presence of Fe(III) in the aqueous phase leads to the rapid formation of amorphous and not very compact flakes. With Fe(II) dosing, the iron (oxide) hydroxides are catalytically formed as deposits on the filter grains (also referred to as ‘adsorptive de-ironing’), which are far more compact and comparable to normal deposits in groundwater filters.

Operational results in full-scale practical application

Based on the research carried out at the WTP Prinsenbosch, Brabant Water has adapted the Arsenic Removal Master Plan. The company will apply Fe(II) dosing to the six relevant water production businesses (arsenic concentration > 1 ug/l). By April 2019, the Fe(II) dosing had already been implemented at the WTP in Prinsenbosch, and the results have been even better than expected. The filtration process turns out to be very robust (not a decisive factor, not even with changes in speed) and the run times of the rapid filters are currently in the order of 120 hours. It should also be noted that, in the old situation with AOCF (Fe(III)/NaMnO4 dose), the run time only amounted to 55 hours.
After the WTP Prinsenbosch, the Fe(II) dosing was subsequently tested at the water production business in Dorst. Here, the dosing of Fe(III) and NaMnO4 could be replaced by only Fe(II), with the same operational benefits as those in Prinsenbosch. The conversion is currently being realised at Dorst. After extensive research on both pilot and practical scales, implementation at the WTP in Oosterhout is now slated for 2021 and at the WTP Tilburg for 2022.
At the WTP’s in Welschap and Eindhoven, the arsenic concentration of the clean water is just barely above 1 µg/l. At these sites, research is being carried out into how operations can be optimised to achieve an As concentration of < 1 µg/l without additional chemical dosing. At the WTP in Welschap, a study is being carried out in which the sand fraction of the pre-filter is enlarged with coarser sand. The naturally present Fe(II) can, therefore, penetrate deeper into the filter bed and adsorb oxidised As5+ there, thereby increasing the efficiency of the arsenic removal. The initial results are promising.

Tim van Dijk
(Brabant Water)
Patrick van der Wens
(Brabant Water)

Summary

Brabant Water has been trying to improve the removal of arsenic to < 1 µg/l since 2013. This was achieved with the use of Advanced Oxidation Coagulation Filtration (AOCF). However, in practice, there were operational disadvantages, such as reduced filter run time, particle breakthrough and poor thickening of the flushing water sludge. In 2018, research was initiated to find a more suitable alternative. After conducting pilot and full-scale studies at the Prinsenbosch production site, it appeared that dosing Fe(II) removes arsenic up to < 1 µg /l and, moreover, it does not have the operational disadvantages of AOCF. Meanwhile, a phased introduction of Fe(II) dosing is taking place at all relevant Brabant Water production sites.


References


Ahmad et al. (2014). Advanced oxidation-coagulation-filtration (AOCF) – an innovative treatment technology for targeting drinking water with < 1 µg.L-1 of arsenic.

Bakker, S. A., et al. (2008). Arseen in drinkwater, niet alleen probleem voor Bangladesh, H2O(16) (Arsenic in drinking water, not just a problem for Bangladesh, H2O(16)): 18-21.

Beek, C.G.E.M. van, et al. (2012) Homogeneous, heterogeneous and biological oxidation of iron(II) in rapid sand filtration. Journal of Water Supply: Research and Technology—AQUA 2012 61.1.

Dijk, Tim van, (2018) Assessment of Fe(II), Fe(III) and NaMnO4 dosing for As removal at WPB Prinsenbosch, MSc thesis TU Delft.

Gude, J.C.J. , et al. (2018). Biological As(III) oxidation in rapid sand filters. Journal of Water Process Engineering.

Wens, P. van der, et al. (2016). Arsenic at low concentrations in Dutch drinking water: assessment of removal costs and health benefits, Sixth International Congress on Arsenic in the Environment (As 2016): Arsenic Research and Global Sustainability, Stockholm, Sweden, CRC Press.

^ Back to start

ARSENIC REMOVAL

Groundwater treatment

Knowledge journal / Edition 2 / 2020

Improved water quality reduces greenhouse gas emissions

The Netherlands reports its greenhouse gas emissions on an annual basis according to the guidelines of the IPPC, the international organisation that coordinates the execution of the Paris Agreement and the Kyoto Protocols. In these reports, greenhouse gas emissions from surface water bodies are not included, despite this accounting for as much as 5% of the total. For four shallow lakes, Deltares and Witteveen+Bos studied the emission of greenhouse gases in relation to water quality. They also developed the first prototype model for water authorities.

In 2019, a method was published for calculating the emissions from surface waters. This is relevant for the Netherlands, because we are a country living with water: more than 18% of our country consists of open water (7,422 km2), a third of which are large lakes (more than 50 ha). Including the Dutch surface waters in greenhouse gas calculations will result in higher reported emissions.
The emission of greenhouse gases from aquatic systems varies considerably on a worldwide basis, from a net uptake to an annual net emission of as much as 90 tonnes of CO2-equivalents per hectare (Webb et al. 2019). In the Netherlands, surface water bodies are estimated to contribute 2.4 to 5% to the total Dutch greenhouse gas emission, possibly even more. Research into actual emissions and the relationship with system characteristics and environmental parameters is therefore desperately needed. The ultimate aim is to develop a method to determine greenhouse gas emissions from surface waters that meets the international requirements and is also sufficiently reliable from a scientific point of view. More and more water authorities want to be able to estimate the emissions of greenhouse gases from aquatic systems, preferably offering perspective for water management.

Balance

Whether a shallow lake emits the greenhouse gases carbon dioxide (CO2) and/or methane (CH4) depends on the balance between carbon sequestration and carbon degradation. In many ecosystems, there is high carbon degradation and net greenhouse gas emissions. Surface waters, on the other hand, can store carbon as accumulated, non-degraded biomass. In particular, In ecosystems with limited carbon degradation, the ecosystem acts as a net carbon sink since net carbon sequestration persists. Wetlands have the potential to store large amounts of carbon. Specifically, wet, hypoxic and acidic conditions slow down carbon degradation considerably. Hence, swamps and fens that are inundated throughout most of the year can store a great deal of carbon, and thereby counteract climate change.
Methane formation almost always leads to a net emission of greenhouse gases, due to the much stronger greenhouse gas effect of methane compared to CO2. However, methane from the waterbed can diffuse in the water column, where it can be converted (microbiologically) into CO2 (methane oxidation). If methane escapes via bubbles through the water column to the atmosphere (ebullition), oxidation is negligible.
The variation in greenhouse gas emissions from surface water bodies is very large, especially since surface water bodies can vary considerably in eutrophication, the amount of organic carbon (saprophication), temperature and ecological state. The greenhouse gas emissions from shallow surface waters is likely to increase in the future due to the rise in temperature. The temperature increase results in higher primary production, followed by an increase in microbial carbon degradation.

Water quality and greenhouse gas emissions

Witteveen+Bos and Deltares have been studying how water quality (e.g. expressed in nutrients and organic carbon) influences the greenhouse gas balance of shallow ponds. In May 2019, we carried out measurements on material from shallow ponds that were selected on the basis of water quality: Loenderveense plas (Waterschap (Water Board) Amstel, Gooi and Vecht), Dobbeplas (Hoogheemraadschap van Delfland), Wormer- en Jisperveld (Hoogheemraadschap (Water Authority) Hollands Noorderkwartier) and Oostmadeplas (Hoogheemraadschap (Water Authority) Delfland). These ponds mainly differ in phosphate load: this is high in the Wormer- en Jisperveld and in the Oostmadeplas (6.6 and 10 mg P/m2/d; respectively) and low in the Loenderveense plas and the Dobbeplas (0.5 and 0.2 mg P/m2/d; respectively). Furthermore, it is known that the load of organic material is high only in the Wormer- en Jisperveld (the exact amount is unknown).
From each pond, we collected five sludge columns and determined in the lab the total flux of CO2 and methane from these columns for a period of four weeks. These column tests measure the net potential for greenhouse gas emission or absorption. Individual processes which contribute to this net flux were not analysed. The emissions measured therefore only provide an indication of the potential emission of the system. This will deviate from the actual emissions in the field.
The emissions from the four ponds show that for good water quality (e.g. low P and organic matter load) the greenhouse gas emission is low (see figure 1). In addition, it can be seen that when water quality is poor (high P and organic matter), greenhouse gas emissions can be increased by up to a factor 10. This large difference is mainly due to the high emission of methane. Methane is a stronger greenhouse gas than CO2 (28 to 36 times stronger). Hence, even a small amount of methane emission, will quickly lead to a high contribution of the total net emission in CO2 equivalents. Emissions of nitrous oxide (N2O; more than 250 times as strong as CO2) were not measured.

Figure 1. Potential greenhouse gas emissions (in mg CO2-equivalent/m2/day) for the Loenderveense plas, the Dobbeplas, the Wormer- en Jisperveld and the Oostmadeplas.

Tool to estimate emissions from surface water bodies

To be able to estimate greenhouse gas emissions and to relate them to the water quality, a prototype model was developed, called ‘BlueCan’. With this tool, an initial estimate of the annual emission of greenhouse gases from lakes and ponds can be obtained. This instrument was based on the frequently applied models PCLake (Janse, 2005) and Delwaq (Los, 2009) and applied to the four case studies. Based on system characteristics including water depth, soil type and nutrient load, the annual emission in CO2 equivalents was calculated, as well as the proportions of CO2 and methane. In this way, water authorities are able to identify shallow lake and pond hotspots whilst also determining the effect of nutrient reduction on emissions. It is important to note that this instrument, in its current form, does not account for the direct input of organic carbon, such as wash off from the banks or fallen leaves. Thus, if these represent an important source of carbon in a pond, the emissions will be underestimated.
The reliability was tested by comparing the model results with the results from the column test (figure 2). The model shows the same trend as the column tests: ponds with a low P load (Loenderveense Plas and Dobbeplas) show the lowest greenhouse gas emissions, while ponds with a high P load show high emissions. Here too, the high emissions are mainly due to the increase in the proportion of methane.

Better water quality, lower greenhouse gas emissions

Measures to improve water quality appear effective at reducing greenhouse gas emissions. In this study, the greenhouse gas emissions from water bodies with good water quality are up to a factor of 10 lower than from waters with poor water quality. The poorer the water quality (high nutrients and organic carbon), the higher the greenhouse gas emission.
The possibilities for reducing greenhouse gas emissions are system-specific. Depending on the system, a large or small gain in water quality can be obtained in conjunction with a large or small reduction in emissions. This offers water authorities an interesting perspective for water management. Lower emissions of greenhouse gases are often accompanied by clear, plant-rich aquatic systems. This is advantageous for the development of nature and biodiversity, as a result of which these waters also become more attractive as recreational and residential areas.

Figure 2. Greenhouse gas emissions of four lakes, calculated with the BlueCan model, against the external P-load. Blue points indicate the emission for the current P-load in the lakes (measured in the field). The lines indicate how the greenhouse gas emission changes, depending on the external P-load.

Expanding and improving the tool

Even if there is a clear connection between greenhouse gas emissions and water quality, there are clear differences between the measurements and the model results. There are several possible causes for this. Firstly, the tool could be even better. The tool now calculates emissions based on data from the four ponds: soil type, temperature and nutrient load. The results are average for the entire water system and for a number of years. All the processes that influence greenhouse gas emissions have not yet been included.
Another cause for differences between tool and measurements is the use of column tests. They indicate the potential emission at a particular moment, while we know that the emissions in the field vary considerably during the year: they are higher in summer and autumn, when the temperatures are higher and microbial carbon degradation is also higher compared to the carbon sequestration. In addition, greenhouse gas emissions have a considerable spatial variation. Bubbling greenhouse gas (ebullition), in particular, is a local and irregular emission route, which leads to peak emissions and therefore considerable uncertainty in the total calculated emissions.
In 2020, together with water and nature authorities, more experience will be gained via case studies, and the tool will be further developed. One of the objectives is to calibrate the model year round on the basis of values from the field.

Conclusions

With the development of the BlueCan model, an important step has been taken to chart emissions from surface water bodies. Poor water quality, and then especially a high P load, results in high greenhouse gas emissions. This makes better water quality even more important, because this not only improves the ecological quality of the system, but also reduces the impact of the surface water bodies on climate change.

Martine Kox
(Deltares)
Sacha de Rijk
(Deltares)
Wouter van der Star
(Deltares)
Marcel Klinge
(Witteveen+Bos)
Sebastiaan Schep
(Witteveen+Bos)

Summary

Surface waters contribute up to 5% of the total greenhouse gas emissions from the Netherlands, and possibly more. Here, the influence of water quality (e.g. nutrients and organic carbon) on the greenhouse gas flux from shallow ponds was studied. Research was carried out in the field, and a first prototype model was developed (‘BlueCan’). Better water quality appears to not only improve the ecological quality but also results in lower greenhouse gas emissions. The emissions from water bodies with good water quality are up to a factor of 10 lower than those with poor water quality. In the coming period, the model will be further tested and improved using case studies and field measurements.


Sources


For more information about BlueCan, see the delta fact ‘Broeikasgasemissies uit zoetwater’ (‘Greenhouse gas emissions from fresh water’) https://www.stowa.nl/deltafacts/waterkwaliteit/diversen/broeikasgasemissies-uit-zoetwater

Webb, J. R., Leavitt, P. R., Simpson, G. L., Baulch, H. M., Haig, H. A., Hodder, K. R. & Finlay, K. (2019). Regulation of carbon dioxide and methane in small agricultural reservoirs: optimizing potential for greenhouse gas uptake. Biogeosciences, 16(21), 4211–4227. https://doi.org/10.5194/bg-16-4211-2019

^ Back to start

GREENHOUSE GASES

Water quality improves reduction

Knowledge journal / Edition 2 / 2020

Monitoring fish in large rivers with eDNA metabarcoding

Fish and other aquatic animals leave traces of DNA in the water. Analysing this 'environmental DNA' (eDNA) represents a novel method for monitoring the species composition in bodies of water. However, it is not simple and straightforward to apply this novel method in major rivers. DNA traces can easily be displaced and diluted. For this study, we researched the detection of river fish in the Rhine River, the Haringvliet inlet and the Nieuwe Waterweg shipping canal.

Rijkswaterstaat is responsible for the healthy ecological condition of national waters according to the Water Framework Directive (WFD). Fish stocks are one of the indicators of the ecological condition. This study researched whether eDNA metabarcoding is an effective and reliable method for monitoring fish species in flowing rivers, fresh tidal waters and estuaries.

eDNA metabarcoding

Fish leave traces of DNA in the water, for example, through their skin mucus and/or stools. Over time, this eDNA typically degrades into shorter DNA fragments. This DNA can be extracted from a water sample and subsequently identified to demonstrate the quality of the occurrence of fish species (presence or absence, ‘community analysis’). The base sequence or genetic code of such DNA fragments is species-specific, enabling identification, in our case, through comparison with a reference database of fish species.
The advantage of eDNA metabarcoding is that it is no longer always necessary to physically catch and identify fish. Another advantage is that the identification of 'difficult' species is no longer reliant on the availability of specialists. This technique can also detect fish that are difficult to catch because, for example, they lead a hidden life or are very rare.
Large flowing waters offer an additional challenge. For instance, the presence of eDNA at a certain location does not guarantee that the species in question is actually present there. eDNA can be carried along from upstream areas or originate from, for example, fish waste. The method is under development, and our research represents another step towards a protocol for the eDNA monitoring of fish species in large flowing waters.

Study design

In 2018, using a boat and a peristaltic pump, we collected samples from the Rhine River near Lobith (near the border with Germany), the Nieuwe Waterweg shipping canal (near Rotterdam) and the Haringvliet inlet. We did this three times in spring (March, April, May) and three times in autumn (September, October, November). Each time 100 ml of water was sampled at ten points along three transverse transects across the waterbody, after which the 10 samples were merged into a 1-litre composite sample. This was carried out three times for each transect: at the surface, 1 metre above the soil and near the shore (i.e. three habitats).
All of the composite samples were filtered directly in the field. The filter membrane was preserved for DNA extraction in the laboratory. New, sterile materials were utilised for each water sample. At every location, distilled water without DNA was also filtered to obtain an impression of possible contamination in the field.
To better understand the effect of the sampling method, we carried out supplemental detailed sampling in May and October. For each body of water, we collected ten 1-litre samples from the most downstream transect, from the surface and 1 metre above the soil.

Laboratory analysis

Laboratory analysis was carried out using specific primers to detect DNA fragments from two mitochondrial fish genes. After being detected, the DNA fragments were multiplied using PCR (polymerase chain reaction). Next, the exact base sequence was determined with the aid of Next Generation Sequencing. Species identification followed by comparing data from a database.
We carried out several controls in order to check the results. As a positive control, for instance, a mock community was analysed, using a sample containing DNA fragments from several freshwater and saltwater fish species in known concentrations. A number of negative controls were also built in to provide an impression of the contamination that can occur during DNA extraction and PCR. A final point is that laboratories may differ in their methods. That is why we randomly selected twenty samples to be analysed by both DATURA Molecular Solutions and the KWR Water Research Institute.

Data processing and analysis

The barcodes obtained and the number of reads per barcode were processed using bioinformatics. The objective of this was to remove PCR and sequence errors and to reduce the chance of false positive detections (e.g. due to contamination). The disadvantage is that this allows rarer species, with a low number of reads, to disappear from the data set. A comparison, therefore, was made between the cautious and the rigorous settings of the bioinformatics steps.

Results

For each of the three waterbodies, the average species diversity for the three transverse transects and the three habitats was approximately the same. However, the total number of species increased as more habitats or locations were sampled. For the Haringvliet inlet, Figure 1 shows the number of fish species per habitat and per transect. Although most species were identified in the riparian habitat and along the three most downstream transects, all other habitat and transect samples provided additional species. Taking multiple samples and/or sampling multiple habitats and locations, therefore, is necessary to obtain a more complete impression of the species composition.
The average species diversity was relatively constant over the year for the Haringvliet inlet and the Rhine River. Species diversity in the Nieuwe Waterweg shipping canal decreased from March to October, after which it increased again in November. The species composition did differ, which is likely due to the migration of some species during certain periods.

Figure 1. Venn diagrams of the number of corresponding and unique species per habitat (left) and per transverse transect (right) in the Haringvliet inlet (location 3 being the most downstream). Overlaps indicate corresponding species.

Influence of the sampling method

The detailed samples were analysed to determine the potential influence of the sampling method on the results. Using species saturation curves (Figure 2ab), we have shown how many 1-litre detailed samples are necessary to acquire a complete picture of the species richness. Obtaining a complete picture of the species richness in the Haringvliet inlet requires, for example, a minimum of ten to twenty samples. Higher numbers may be required in more species-rich waters. The season also has an influence.
The number of species detected in a single composite sample is naturally lower than in ten 1-litre detailed samples. This has been observed in both surface and soil samples in all three waters. By way of illustration, in the Haringvliet inlet, four KRW target species were detected in one composite soil sample (image 2c, red line), in the ten corresponding detailed samples 7. One exception occurred in May in the Nieuwe Waterweg shipping canal, when more than twenty-five KRW target species were detected in a single composite sample, compared to thirty-one in the detailed samples.

Differences between laboratories

The detection and analysis of the same samples by the DATURA and KWR laboratories resulted in species lists that were largely overlapping (62%). The difference is due in part to the fact that the laboratories differ in how they perform the identification: using primers of one or two mitochondrial genes. The reference databases and bioinformatics also differ. This is also characteristic of eDNA monitoring at present: the method is developing rapidly but standardisation is still a long way off.

Figure 2. Above: species saturation curves for KRW target species in the Haringvliet inlet based on detailed samples collected in May 2018 (a) and October 2018 (b). Soil and surface samples are taken together (20 samples). Below: a comparison between the number of KRW target species detected in one composite sample (red line) and the species saturation curve of ten detailed samples collected at the same site, during the same month, from the same habitat (soil (c) and surface (d)).

Significance for practical application

Our results demonstrate that eDNA metabarcoding is suitable for obtaining a qualitative impression of the species composition of a fish community in running waters. It is necessary to take several samples with spatial variation (location, habitat) and/or seasonal variation to obtain an impression of species richness that is as complete as possible.
Taking multiple samples with a larger volume generally results in detecting more species than a composite sample with a smaller volume per subsample, but this also requires a greater research effort in the field and in the laboratory. When sampling a body of water, fifteen to twenty-five 1-litre samples are sufficient to detect approximately 90% of the species present.
To generate a consistent and reliable multi-annual data set for fish monitoring, it is, as always, important to document the methods and working protocols so that re-analysis of raw data sets with revised insights remains possible (bioinformatics and reference databases). In time, once methods have sufficiently developed nationally and internationally, standardisation will also aid the generation of this data set.

Future research

To realise an operationally applicable protocol, several issues will be further researched, such as the influence on the completeness of the impression of the species measured with larger volumes per sample, different filter types and the sampling effort (spatial and temporal). Research will also examine how the costs and benefits compare with traditional fish sampling.
The application of ecological knowledge supported by additional fish research (e.g. traditional fish sampling) remains indispensable to safeguard the results of this new methodology and subsequent interpretations. For example, the geographical coverage of eDNA samples may differ from traditional sampling techniques. The eDNA detected does not necessarily originate from the immediate vicinity of the sampling site. Consequently, the use of eDNA to detect a species does not always conclusively indicate the local presence of a species. Complementary (field) research, expert judgement and proper control steps should keep the risk of misinterpretation to a minimum. One should not forget, however, that traditional fish monitoring also has its own limitations.

Miriam Schutter
(Bureau Waardenburg)
Nils van Kessel
(Bureau Waardenburg)
Kees van Bochove
(Datura Molecular Solutions)
Michiel Hootsmans
(KWR Water Research Institute)
Mervyn Roos
(Rijkswaterstaat)
Gerrit Vossebelt
(Rijkswaterstaat)

Summary

Fish leave traces of DNA in the water. Analysing this 'environmental DNA' (eDNA) offers a new way to monitor fish. This study looked at how 'eDNA metabarcoding' can best be tackled in the major rivers, where the current can significantly impact the results. Here too, eDNA analysis appears to be a sound method for visualising the composition of fish species. However, the method of sampling is crucial, and ecological knowledge is still required to ensure an accurate interpretation.


References


Beentjes K. 2020. Deltafact: DNA-technieken voor waterbeheerders (DNA techniques for water managers). STOWA. https://www.stowa.nl/nieuws/dna-technieken-voor-waterbeheerders. (in Dutch).

Schutter, M., N. van Kessel, K. Van Bochove, M. Hootsmans & E. Kardinaal, 2019. Effectiviteit van eDNA metabarcoding voor vismonitoring rijkswateren (Effectiveness of eDNA metabarcoding for monitoring fish in national waters). Bureau Waardenburg Report no. 19-147 Bureau Waardenburg, Culemborg. (in Dutch).

^ Back to start

MONITORING WITH EDNA

Detection of fish in large rivers

Knowledge journal / Edition 2 / 2020

Which microorganisms ensure our clean drinking water?

Sand filtration is important for the production of drinking water from groundwater. The precise operation of sand filters is still surrounded by many questions. This study examines which microorganisms are involved in the removal of ammonium and methane.

In the Netherlands, more than two-thirds of the drinking water is produced from groundwater. Groundwater has a relatively stable composition and is already of high quality. However, it does not meet the quality requirements for drinking water in order to prevent health risks and problems during distribution. In particular, the concentration of ammonium and methane is often too high; other compounds that have to be removed as well are nitrite, nitrate, manganese and iron. These compounds can be toxic, can result in a strange smell or taste or in growth of microorganisms in the distribution pipes. Gaseous substances, such as methane and sulphide, will be removed from raw groundwater first; usually by means of extensive aeration (stripping). Next, further purification is performed by sand filtration, a technique that has been used for a long time for the production of drinking water. In the sand filter, a combination of physical, chemical and biological processes ensures the removal of many contaminants, including the above-mentioned compounds.

Determining the microbial population

In this study, the microbial composition at various locations in the sand filters of pumping station Breehei (Limburg Water Supply Company; Waterleiding Maatschappij Limburg, WML) is examined. The study is focussed on the removal of ammonium (NH4+) and methane (CH4). At different time points, samples were taken from the primary and the secondary sand bed and from the biofilm of the wall of the primary filter. The concentration of methane and nitrogenous compounds in the water was determined as well (figure 1).

Figure 1. Schematic view of the studied pumping station. Groundwater is pumped up and led over two sand filters (the primary sand filter; P-ZF and the secondary sand filter; S-ZF). The concentrations of methane (CH4), ammonium (NH4+), nitrite (NO2-) and nitrate (NO3-) at various locations are illustrated. Samples of P-ZF, S-ZF and the biofilm (BF) were taken at various times. NG = not measured (in Dutch, niet gemeten).

The vast majority of microorganisms cannot be cultivated in a laboratory. To investigate the microbial composition of the samples, we therefore used Next Generation Sequencing (NGS). With NGS, DNA is extracted from a sample which is subsequently sequenced. Next, the obtained DNA sequences are compared to DNA from known microorganisms in databanks. In this way, a ‘microbial fingerprint’ of the sample emerges. It is also possible to investigate whether so-called ‘marker genes’ are found, these genes code for enzymes which catalyse microbial conversions. This gives an impression of the potential microbial activity in the sample. Examples of these types of genes are amoA (a subunit of ammonia monooxygenase, which catalyses the conversion of ammonia into nitrite) and mmo (methane monooxygenase, which catalyses the conversion of methane into methanol) (Figure 2). By combining this technique with measurements of the concentration of different compounds in the water, it can be deduced which microorganisms can be responsible for a particular conversion.

Figure 2. Preventing ammonium and methane monooxygenase (amo and mmo) genes in the primary and secondary sand bed (P-ZF and S-ZF) and the biofilm. The number of amo and mmo genes was normalised. A. The archaeal amoA gene (pink) was only found in the biofilm. The majority of the amoA genes found are bacterial (green and blue), the largest part of which is comammox Nitrospira (dark green: A variant; pale green: B variant). B. The methane monooxygenase was found in all the samples. It is remarkable that the relation between p-mmo (blue) and s-mmo (grey) in the biofilm samples varies in time. In general, smo is the most common gene in the primary sand filter and p-mmo in the secondary sand filter, where it should be noted that the amount of mmo genes in the primary sand bed is significantly greater.

Comammox Nitrospira

Most of the ammonium is removed from the ground water by the primary sand bed (Figure 1). The concentration of oxygen in the water is high and nitrite was detected in this sand bed as well, therefore it can be assumed that the ammonium is removed via nitrification: the conversion of ammonium via nitrite to nitrate.

Multiple different microorganisms are capable of catalysing the various steps of nitrification. The bacteria Nitrosomonas and the archaeon Nitrosopumilus, for instance, convert ammonium into nitrite, which is then oxidised into nitrate by nitrite oxidizing bacteria like Nitrospira. Both ammonium and nitrite-oxidising microorganisms were found in sand filters, but often these so-called Nitrospira were over-represented. This is less strange than it appears, since it was discovered in 2015 that Nitrospira are also capable of ammonium oxidation. Nitrospira can therefore perform both oxidation steps, from ammonium into nitrite as well as from nitrite into nitrate. This process is called complete ammonium oxidation (comammox). The ammonia monooxygenase enzyme of this so-called comammox Nitrospira deviates from this enzyme that we knew from other ammonium oxidising microorganisms.

Microbial removal of ammonium

With NGS, amo genes were found from both Nitrosomonas and Nitrosopumilus (Figure 2) in the sand beds. However, the largest proportion of the amoA variants found belongs to comammox Nitrospira. As such, these microorganisms are therefore most likely the main ammonium oxidising microorganisms in this sand bed and explains the over-representation of Nitrospira bacteria compared to other nitrifying microorganisms. This result corresponds with other studies which investigated the microbial composition of sand filters; also in Danish drinking water production facilities a high abundance of comammox Nitrospira was found . The concentration of nutrients in the raw groundwater which has to be purified is low. It appears that comammox Nitrospira are welladapted to live in such conditions; they are typical K-strategists: organisms with a low growth rate but a very high growth yield.

Remarkably, two different types of comammox Nitrospira amoA genes were found, the A variant (clade A) and the B variant (clade B). Clade A commammox bacteria are the main group in the first sand bed, while clade B comammox bacteria are most abundant in the second sand bed and in the wall biofilm of the primary sand bed. Little is known about clade B comammox Nitrospira. The only information which is available is based on DNA sequencing; no pure or enrichment cultures are available in laboratories. Therfore, the exact role of these microorganisms in drinking water production remains unclear.

Microbial removal of methane

The raw groundwater of pumping station Breehei also contains a high concentration of methane (CH4). Most of this escapes during the aeration step (stripping) into the air. However, a low concentration of methane remains in the raw groundwater. Microorganisms in the sand bed can oxidize methane into CO2. The first step of methane oxidation is catalysed by the enzyme methane monooxygenase (mmo) of which two variants are known: the membrane-bound (particulate, p-mmo) and the unbound (soluble, s-mmo) variant. Both forms were found in the sequence data (figure 2). The p-mmoA genes found are characteristic for the methane oxidising microorganisms belonging to the Gammaproteobacteria. It is known for a long time that these bacteria are able to oxidise methane. The s-mmo sequences found belong to a organism from the family Methylomonadaceae. So far, it has never been shown that these microorganisms can oxidize methane. However, this microorganism is highly abundant in the primary sand bed, suggesting that it does play a role in the conversion of methane into CO2.

Conclusions

In this study, the microbial composition of two sand filters of a drinking water production plant was investigated using Next Generation Sequencing (NGS). We could show that commammox Nitrospira appear to be the most common ammonium oxidising microorganisms. In the first sand bed, comammox bacteria belonging to clade A were the most abundant, whereas clade B comammox bacteria were more abundant in the secondary sand filter. Further research is required to understand the role of comammox clade B. More knowledge about the competition and collaboration between the different ammonia and nitrite oxidizing microorganisms might give an answer to the question why sand filters sometimes no longer remove ammonium completely or nitrite accumulation takes place. This merits further research. Furthermore, it is an interesting fact that methane oxidising bacteria are active in the sand bed. Perhaps, the presence of these microorganisms can be used in the future to reduce the emission of the strong greenhouse gas methane by drinking water production plants. At the moment these ammonium and methane oxidising microorganisms are being further investigated in laboratory scale sand filters.
This study contributes to a better understanding of the processes in the sand bed which might prevent problems in sand filtration or can reduce the time required to start up sand filters.

Maartje van Kessel
(Radboud University)
Lianna Poghosyan
(Radboud University)
Sebastian Lücker
(Radboud University)
Martine Kox
(Deltares)

Summary

Sand filtration is important for the production of drinking water. In these sand filters, contaminants from the raw water, usually groundwater, are removed through a combination of physical, biological and chemical processes. This study examines which microorganisms are involved in the removal of ammonium and methane. Ammonium is largely converted by comammox (complete ammonium oxidation) Nitrospira, a bacteria which can completely oxidate ammonium into nitrate. Methane is mainly removed by stripping (aeration) but is also oxidised into CO2 by microorganisms in the sand filter. A good insight into the microorganisms involved in drinking water production can help us to better understand and optimise sand filtration.


References


Fowler S.J., Palomo A., Dechesne A., Mines P.D., Smets B.F. (2018) Comammox Nitrospira are abundant ammonia oxidizers in diverse groundwater-fed rapid sand filter communities, Environmental Microbiology 20

Kessel M.A.H.J. van, Speth D.R., Albertsen M., Nielsen P.H., Op den Camp H.J.M., Kartal B., Jetten M.S.M., Lücker S. (2015) Complete nitrification by a single microorganism, Nature 528

Kits K.D., Sedlacek C.J., Lebedeva L.V., Han P., Bulaev A., Pjevac P., Daebeler A., Romano S, Albertsen M., Stein L.Y., Daims H., Wagner M. (2017) Kinetic analysis of a complete nitrifier reveals a oligotrophic lifestyle, Nature 549

Poghosyan L., Koch H., Frank J., van Kessel M.A.H.J., Cremers G., van Alen T., Jetten M.S.M., Op den Camp H.J.M., Lücker S. (2020) Metagenomic profiling of ammonia- and methane-oxidizing microorganisms in two sequential rapid sand filters, Water Research 185.

^ Back to start

SAND FILTRATION

Role of microorganisms

Archive


Edition 1/2020


Edition 2/2019


Edition 1/2019


Edition 1/2018


Edition 2/2017


Edition 1/2017


Edition 2/2016


Edition 1/2016


Edition 2/2015


Edition 1/2015

ARCHIVE

Previous editions

Knowledge journal / Edition 2 / 2020

ABOUT WATER MATTERS

The knowledge section Water Matters of H2O is an initiative of


Royal Dutch Waternetwerk
Independent knowledge networking organisation for and by Dutch water professionals.


Water Matters is supported by

Alterra Wageningen University
Research institute that contributes by qualified and independent research to the realisation of a high quality and sustainable green living environment.


ARCADIS
Global natural and built asset design and consultancy firm working to deliver sustainable outcomes through the application of design, consultancy, engineering, project and management services.


Deltares
Independent institute for applied research in the field of water, subsurface and infrastructure. Throughout the world, we work on smart solutions, innovations and applications for people, environment and society.


KWR Watercycle Research Institute
Institute that assists society in optimally organising and using the water cycle by creating knowledge through research; building bridges between science, business and society; promoting societal innovation by applying knowledge.


Royal HaskoningDHV
Independent international engineering and project management consultancy that contributes to a sustainable environment in cooperation with clients and partners.


Foundation for Applied Water Research (STOWA)
Knowledge centre of the regional water managers (mostly the Water Boards) in the Netherlands. Its mission is to develop, collect, distribute and implement applied knowledge, which the water managers need in order to adequately carry out the tasks that their work supports.

ABOUT WATER MATTERS