CONTENTS

Knowledge section / Edition 1 / 2015

PREFACE

Presenting: Water Matters!

This is the first edition of Water Matters, the knowledge section of H2O magazine. The Netherlands have a lot to offer regarding knowledge development in the water sector. This is reflected in the first issue of this ’knowledge section’. It has been supported by seven important players in the Dutch water sector: Alterra Wageningen University, ARCADIS, KWR Watercycle Research Institute, Netherlands Water Partnership (NWP), Royal HaskoningDHV and Foundation for Applied Water Research (STOWA), whom we kindly thank.
This new issue will be published twice a year and is committed to the ambition of presenting the best actual knowledge produced by the Dutch water sector, in its broadest sense, in the past period. Knowledge with great value for practice, in the long and short term.
The seven parties facilitating this initiative have decided to set high standards. This means a strict selective admission guarded by a redaction board that is chaired by an independent chairperson and a tough content review of the articles, whoever may be the author. And, it needs to be said at this first edition, Water Matters is open for anybody in the Netherlands who is convinced of the usefulness of his or her contribution and willing to have it judged independently.

We hope you will enjoy reading this first issue.

Monique Bekkenutte Publisher (H2O Foundation)
Huib de Vriend Chairman editorial board of Water Matters

PREFACE

Presenting: Water Matters!

Knowledge section / Edition 1 / 2015

Future possibilities for waste water

The sewage treatment plant was originally intended to protect human health against pathogens. Over time- through rules and regulations- protecting surface water quality in addition. That will remain the case. Our realisation of the fact that waste water is a source of valuable natural resources however, will change. We are at the start of an exciting route. Where will it lead?

In 1914 the activated sludge system (Ardern & Locket) was invented. Its principle is that micro-organisms help cleaning waste water. During the past year the centennial celebration has been memorised in many ways. Rightly so, because activated sludge can be considered to be the turning point in waste water history. The infrastructure of today still gratefully uses the basic principles of that period. Mainly in the period from 1970 to 2000 when increasingly strict effluent demands initiated a fast development. Numerous ingenious systems that made us capable of integrating the different processes of nitrogen and phosphate removal have since been realised. During 30 years substantial investments to meet all effluent requirements at sewage treatment plants have been imposed, that (in combination with emission reduction by the agricultural sector) has improved the water quality of the larger rivers.

Downsides active sludge

However, activated sludge knows downsides. Those of us familiar with waste water instantly recognise a sewage treatment plant: many circular black classic clarifiers. Large amounts of space capacity certainly is definitely a downside.

For a long period of time a serious threat was formed by the presence of filamentous bacteria. These bacteria negatively influence the settling of the activated sludge (so called bulking sludge). We have fought the unwelcome intruders and have successfully overcome the activated sludge system crises. Ignorant of the fact that these filamentous bacteria could later become a useful chain in the production of resources, namely the storage of lipids in eg. bio diesel production.

And then there was still the high use of energy necessary to enter oxygen in the aeration unit. Cost reduction can be realised by the introduction of aeration devices with a higher efficiency and through support with advanced control and monitoring instruments. To push the energy label of an activated sludge system further to an A-score, the breakthrough of new bio process technology is essential.

The activated sludge system also produces large numbers of sewage sludge. This positively sounding product is particularly treated as waste in the Netherlands. Now the energetic value is much better used. In a very short period of time a large variety of possibilities for optimizing the sludge digestion has emerged. Thermophilic digestion and all sorts of varieties of thermal hydrolysis have quickly come into practise. It seems like we suddenly do not give each other time to gain experience with first good practice anymore.

Different perspectives

Waste water treatment permanently shows to be a fertile ground for the development of new innovations. Innovations of the past 50 years that have been the most striking originate from training (micro)organisms jointly responsible for of our waste water treatment.

A good example is the possibility of the recovery of phosphate from waste water through biological phosphorus removal. By varying anaerobic, anoxic and aerobic circumstances, all biological treatment processes can work together in an integrated way to achieve a good effluent quality. Biological phosphorus removal not only prevents intensive usage of chemicals, but makes the recovery of phosphate at the waste treatment plant more efficient as well.

Therefore in the perspective of sustainability it is good to notice that many water boards are involving biological phosphorus removal as a management goal. At a waste water treatment plant however, this does not lead to a total phosphate recovery to the chain. If the aim is to reach the full 100 percent, sludge processing should be the way. In this steps are planned for incinerator ash from incinerators. But should it not have to be a challenge for all end users?


Several innovations regarding nitrogen removal have passed by as well. Again and again a shorter route to remove ammonium as nitrogen gas from waste water was found. The largest step regarding this was made when bacteria capable of anaerobe ammonium oxidation (Anammox®) could be identified and produced.

This process runs without adding a carbon source and gives a reduction of 50 percent of the costs of aeration energy. Worldwide several implementation forms have been developed but the Netherlands fulfil a fairly leading position in this market. It has to be noted however that during the first ten years it mainly was a niche technology for the treatment of sludge liquor after digestion and for industrial streams treated with anaerobic processes. Presently the introduction of the Anammox®-process in the waterline of the activated sludge system is in progress at waste water treatment plants Dokhaven and Velsen. The nearly forgotten AB-process is with respect being transformed at these locations.

Next era

It is common knowledge that the Dutch have again been capable of developing a new treatment technology. Sequel to hundred years of treatment based on flocculent sludge, the new era of implementing granular sludge that will steadily gain ground internationally has started.
In cooperation with water boards, scientific and business organisations Nereda® has successfully been introduced in the market. An example where bioprocessing technology meets reactor design. The sedimentation tanks can finally be abolished because of granular sludge. Recent experience has shown that a space reduction of 75 percent and an energy use reduction of 40 percent can be realised to obtain a nice effluent quality without the use of chemicals. But we have to keep in mind that granular sludge consists of alginate, a polysaccharide for 15 to 20 percent. At the moment it is investigated whether this alginate can be extracted from the granulaa sludge to be distributed as a valuable resource in for instance the paper industry. With Nereda® a new generation of waste water treatment has come to existence.

Valuable treatment

For a long period of time innovations have been driven by strict regulations and the desire to optimise and preserve existing processes. An important extra driving force is added now waste water, after Liernur in the 19th century, is finally being recognised as a source of many materials. Energy, phosphate and water have since long been identified as possible resources. And what about the sewage sludge formerly referred to, at one time a fine fertilizer and soil improver. A recent study (STOWA, 2014) carefully suggests the possibility to reconsider soil application of sludge. Namely, Europe is much less strict than the Netherlands.
Today cellulose, alginate, polyhydroxyalkanoate (PHA), lipids, CO2 and humus acids are mentioned more and more often as possible resource from waste water. A new playground has literally come to existence, in which science, water boards and business organisations share common interests. The organisation of the golden triangle within the own sector can no longer be sufficient to grant future ambitions. The model is getting more complex because the cooperation forces for sectorial borders to be crossed. And we need to look further into the production chain than we were formally used to. Within this complexity we will repeatedly have to ask each other the right questions to make it all happen. One sensitive question for instance that will always arise is to what extent it is objectionable that waste water can be a source for our new materials.

Let’s turn to the phosphate example once more. Every day we are made aware of the worrying prospect of rapidly using up our global supplies. The knowledge that it is simply possible to recover phosphate from waste water as tricalcium phosphate or struvite has been familiar to us since the eighties of the former century. It is also known that on a European scale 15 percent of our phosphate import can be replaced by phosphate from our sewage water. Despite recent progress in the realisation of recovery installations, the current momentum is slow. This is caused by the difficulty of fully recognising the complexity between all parties involved. Struvite from a waste water treatment plant is not a product but mainly a low valuable raw material.
In fact this issue arises for all sorts of raw materials from waste water. Only further processing can generate a product with a stabilised quality sufficient to the user’s demands. The chain between producer and user still is practically missing. Another important issue that needs to be solved is where does the public domain end and does the private domain take over in the chain from waste material to product. The product should be economically interesting enough to inspire private entrepreneurs to collect waste as their raw material; a new custom look for the old fashioned peel farmer.

One thing is sure: We are jointly heading for exiting times. The route to the waste water treatment plant of the future is challenging and will regularly show an unconventional character We must really be willing to travel this road together. Each one of us from his or her own specialism and significance in empowering the entire group. In transit we can determine the route and the necessity to have fellow travellers join in unity. It is crucial that we share the panorama together and not just admire it from a solo perspective. A joint journey to an innovative and valuable future.

Mark van Loosdrecht
(Technical University Delft)
Paul Roeleveld
(Royal HaskoningDHV)


Summary

The primal aim of our waste water system is to protect public health through secure drainage and processing of human waste. In time extended with the protection of surface water quality with the removal of organic matter and nutrients. That will remain the case in future.

Since 2010 an ambitious goal has been added. With the desire to preserve waste water treatment plants (wwtp’s) the sector has again become aware that our waste water is a valuable source for numerous raw materials. Currently this ambition is the most important thrive in the development of the future waste water treatment plants. We are fully looking forward to the future, but remember to look back and around you as well. If we can keep each other focussed, a promising future is to be expected.

^ Back to start
WASTE WATER FUTURE

The start of an exciting route

Knowledge section / Edition 1 / 2015

Waste water treatment plant as CO2 producer

Several waste water treatment plants produce biogas. That is processed into green gas, which releases (bio based) CO2, a residue that burdens the climate and for which a market exists. For example greenhouse cultivation. Which are the possibilities here and what is the business case? ARCADIS carried out a research commissioned by the Foundation Applied Research Water management (STOWA) and two water boards, with promising results.

At waste water treatment plants biogas is produced by fermentation of sludge. Currently this is often converted to electricity and heat through cogeneration. This (partly) covers the energy demand of the treatment process. Revaluating biogas to green gas in liquid or solid form is also possible. This green gas can be supplied to the natural gas network or (in liquid form) to gas stations. With the development of energy factories and the reduction of the demand for energy and heat on the waste water treatment plant ground, upgrading from biogas to green gas is becoming increasingly interesting.

Another interesting point is the residue bio based CO2 that is released in the upgrading process. In the upgrading process a CH4-rich stream (green gas) is formed as well as – depending on the chosen technology – a concentrated flow CO2. This residue has hitherto been overlooked. Instead of emitting this into the atmosphere, it can be marketed. This is interesting for several different reasons.

Primary because it can add to climate goals water boards and the government are committed to reduce the emissions of greenhouses with 30 percent in 2020 (compared to 1990). At this moment three different strategies can reach this goal:
• Energy saving measurements
• Own sustainable energy production
• Reduction of possible nitrous oxide from waste water treatment plants.

CO2 production from biogas is a new strategy for the emission reduction goal water boards should deploy. If all waste water treatment plants were to apply this concept regarding sludge fermentation 25 percent of the climate goals of water boards would be realised.

Further benefits

However more possible benefits occur. The energy demand (GER-value) of CO2 production from biogas is circa 80 percent less than is the case with conventional production of CO2; which makes this production method (as a chain measurement) interesting regarding the long term agreement energy-efficiency, water boards have been committed to. If subsequently the CO2 is applied in the drinking water industry, the water cycle can be further closed. And finally, provided the process is well established, the CO2 production and biogas can be made profitable.

The water board can fulfil two roles on the market: it can either produce and supply CO2 in the organisation or outsource the activity. The potential market share of the water boards is determined by mapping the market share of CO2 in the Netherlands in view of this investigation. A limited number of CO2-producers is active in the Netherlands. More often than not these producers are also supplier and/or distributor. The total industrial CO2 supply amounted to 1,239 kilotons in 2012. In that same year the total amount of CO2 emission from biogas of waste water treatment plants was 53 kilotons.

So the potential market share of water boards amounts to a maximum of 4 percent. The effect to the CO2-price at market entry of water boards will therefore be limited.

The different market parties have been made transparent through a market analysis. CO2 purchase is occurring in the greenhouse cultivation sector, the food industry and drinking water industry. In the food industry CO2 is being used as a preservative and in the drinking water sector for the correction of pH-values. In the greenhouse sector CO2 is added to increase crop growth. Water boards have good opportunities in providing the greenhouse sector. On the one hand the demand for CO2 increases due to upscaling, on the other hand the own CO2 production from cogeneration installations decreases at existing companies. The latter mostly due to the appeal of alternative heat sources, increasing energy costs and low quality of self-produced CO2.

Market changes and limitations

The market potential for the water boards has been made transparent by use of the five power model by the American economist Michael Porter. Apparently a limited number of suppliers are very powerful on the CO2 market. Clients however are less powerful, each being a relatively small player. Furthermore, substitutes form a limited thread to the CO2 market; the situation is rather that CO2 in itself could form a substitute for other ‘hazardous’ substances.

Other parties besides water boards entering the market and the significance of this in view of competition was also investigated. Apparently potential market entrants will only form a limited thread for the water boards. With its limited volume a water board could only achieve a modest market position. The competition is rigid due to long-term contracts and valuable installations. In the analysis the price of CO2 was taken into account. Several expert interviews indicate that it is realistic to assume a stable, possibly rising, price level .This price will – dependent on quality – vary between 65 to 100 euro’s per ton.

CO2 extraction techniques

Considering technology. Sufficient techniques appear to be available for CO2 production. Biogas can be recovered with a large scale of concepts: membrane filtration, pressure/temperature switch adsorption, cryogen separation, chemical absorption and physical adsorption. Depending on the applied technology and the client’s demands, extra filtration of the CO2 is needed. This can be achieved by:
• Cryogen separation: the cooling process converses the CO2 to liquid so that it becomes
separable from the rest gas. This method provides a high quality CO2 (sufficient to the Kiwa ATA norm). If this is applied full stream fluid biogas (LBG) can be extracted as well.
• Chemical absorption: after cryogen separation this method supplies the best separation efficiency. The product can be supplied to the greenhouse sector. The food industry requires cryogen post-purification.
• Switch adsorption and membrane filtration: these techniques supply a product that, regardless of the distribution market, requires cryogen post-purification.
• Physical adsorption: in this process large amounts of air are used to desorb and dispose CO2. Consequently a highly diluted CO2 stream residues, which makes extraction of this product unachievable.

Sampling

To determine the CO2 quality on existing installations at waste water treatment plants, indicative CO2 samples of the installations on the waste water treatment plants of Beverwijk and Haalem – Waardenpolder were taken. The operational installations however are currently not optimized for CO2 delivery. Besides, the samples occurred to be complicated to obtain and to conserve as well. The results obtained do therefore not yet show the right potential quality which according to suppliers could be reached in a situation applicable to CO2 delivery.

Both in Beverwijk as well as in Haarlem Waardenpolder the fraction methane in the CO2 gas after cryogen separation fluctuates between respectively 0 and 1.2 and 0.5 and 2.5 percent. Suppliers expect that this can be reproduced to the desired composition by a simple alteration of operational settings. It is expected that simple process technological adjustments can further reduce the possible methane emission. For cogeneration methane slip installations resistance of the same order of magnitude is registered. Methane slip and reduction at cogeneration as well as installations for the upgrading of biogas demand further research.

Financial evaluation

The financial aspects have also been reviewed. Financially CO2 production is not inferior to any other strategy to limit CO2 emission. Regarding the financial evaluation two routes have been considered: a waste water treatment plant with an existing installation for the upgrading of biogas, and a waste water treatment plant with an upgrading installation that still needs to be constructed.

In case of an existing installation – dependent on the applied technology – there is potential for the application of the concept. With appropriate technologies the payback differs from 1 to 12 year, dependent on the market party supplied to.
Placing a CO2 production installation for an existing cogeneration seems financially less attractive. The revenue from green gas and CO2 are at this stage not sufficient to cover for the lack of electricity revenue and the depreciation of the installation.

Goals

As previously mentioned, water boards are committed to the climate agreements with among others the goal for reduction of greenhouse gas emissions. Achieving these goals usually take expenses. So even in case the CO2 production on the waste water treatment plant does not result in extra income (no payback to the investment) still the technology could be efficiently used as a strategy to meet the climate agreement goals: other strategies might indeed be more expensive.
The efficiency of the CO2 production has been determined in cost price per avoided ton CO2 emission. In case the costs of the CO2 emission reduction are compared to other ways to limit emission, the costs of CO2-production are in the same range: 5 to 14 euro’s per ton CO2 at new construction of an installation for upgrading biogas. Besides the GER-value of the CO2 from biogas is circa 80 percent less than that of CO2 that was conventionally produced.

So the concept offers opportunities for the water boards to sufficiently meet the agreements on climate goals and goals regarding energy – efficiency. The report contains the change charts in which waste water treatment plants with large fermentation installations and horticultural areas are shown. With this chart it can be determined which waste water treatment plants have potential to become CO2 suppliers for the horticultural sector.

Anthonie Hogendoorn
Jeroen Hulzebos
(ARCADIS)
Wouter van Betuw
(ARCADIS, nowadays Nijhuis Water Technology)
Cora Uijterlinde
(STOWA)


Summary

Committed by the Foundation of Applied Research Water management (STOWA) the market potential concerning technical chances of CO2 production from biogas for several water boards have been explored. Besides the supply of a valuable resource CO2, the concept adds to the realisation of goals in the area of climate an energy reduction. The potential CO2 production of biogas from waste water treatment plants forms only a few percent of the Dutch CO2 market. Additionally approximately 25 percent of the agreed climate goals can be achieved by CO2 production with fermentation in all waste water treatment plants. Cryogen separation produces the highest quality CO2. Depending on which trading market for other technologies post-purification is required. Financially the concept offers positive business cases in case of the installations for biogas upgrading are already present. In case biogas is not yet upgraded, the costs per ton of avoided CO2 emission are comparable to other concepts.

^ Back to start
CO2 FROM WASTE WATER

What is the business case?

Knowledge section / Edition 1 / 2015

Degrading medicines with less energy use

Micro pollutants such as medicinal products and pesticides are detected in water sources more and more often. They can be degraded by treatment in a UV/H2O2-reactor but that process is very energy consuming. In cooperation with Wetsus, KWR Water cycle Research Institute has developed models to improve the process and the reactor. The improved reactors were built by Van Remmen UV Technique and use 30 to 40 percent less energy to achieve the same result.

Many drinking water sources contain medicine residues. Surface water contains more medicinal products with more often higher concentrations while medicines are found in groundwater as well. Due to ageing and climate change concentrations are expected to increase. Purification processes are not fully prepared for this. Therefore some drinking water companies are already extending their purifications, where others are investigating possibilities. Membrane processes and (advanced) oxidation (such as UV/H2O2- processes) play an important role in this.

UV/H2O2-processes are based on photolysis. That is the occurrence of a reaction of a molecule at the moment of absorbing (UV) radiation. In this way some organic micro pollutants can be degraded. However not all molecules are sensitive to this. In that case adding hydrogen peroxide can be a solution. When hydrogen peroxide is added photolysis makes it fall apart in two hydroxyl radicals, that give good reactions to a large scale of substances.

Processes that use such hydroxyl radicals are called ‘advanced oxidation processes’. In that way micro pollutants such as medicinal products can be decomposed. The exact composition of the water, the so-called water matrix, plays an important role in this process. For instance the presence of radical scavengers like nitrate and (bi)carbonate ions can interfere with the oxidation by use of hydroxyl radicals. The procedure of the reactions depends on the UV dose the molecules receive, which is dependent on the flow conditions in a reactor.

A model that can calculate the demolishing of organic micro pollutants by a UV/H2O2-reactor in all sorts of water compositions has been developed. This model consists of a kinetic part, that describes the (photo) chemical reactions as a function of the UV-dose and a CFD part (CFD = computational fluid dynamics) calculating the hydrodynamics in a reactor. With the help of CFD the dose distribution in the reactor can be determined. By combining these data, the conversion of the material in the reactor can be forecast.

Model forecast for improvement in conversion of medicinal products, regarding standard disinfection reactor (D130). This obviously performs less compared to a specially design for oxidation (D200). Subsequently this has been further optimized for the higher UV-transmissions, leading to a further improvement (NEW). Above from left to right the three reactors: D130, D200 and NEW.

These models can additionally be used to calculate the results of an adaptation of the reactor geometry. This can optimize the reactor.

Models

The conversion process of a molecule strongly depends on its characteristics and on circumstances (such as the composition of the water matrix). This can be experimentally determined but this is very expensive. With the use of models the conversion can be determined without the need of expensive analyses and experiments. Besides, alterations in the water matrix or adaptations of the UV-reactor can be applied relatively simple, without the necessity of new measurement campaigns. Demolition of organic micro pollutants is described by a complex reaction mechanism with a large number of (photo) chemical reactions. Herewith ultra-reactive radicals (like the hydroxyl radical) that subsequently cause new reactions are formed. Besides the composition of the water matrix is of great importance. In the kinetic model relevant (photo) chemical reactions are recorded, inclusive of the (unintentional) reactions of chemicals that are found present in the water matrix such as nitrate and hydrogen carbonate. In this way the conversion of the substances as function of the UV-dose can be calculated

In practice both low pressure (LP) and medium pressure (MP) UV-lamps are used, the model can apply to both systems. The model needs a few characteristics of the substance, such as reaction constants, and parameters that describe the photolysis. An overview of data known from literature combined with own experiments was drawn.

Reduction in energy use by the improved reactor design (D200) in view of the standard disinfection reactor(D130) at 90 percent transformation of the different substances (the so called EEO: electric efficiency per order)

In the UV/H2O2-reactor the water flow (hydrodynamics) plays an important role. With use of computational fluid dynamics (CFD) this water flow can be mapped. For this the commercial package COMSOL has been used (version 4.4). Simulating a water flow is complex, certainly since the flow in UV-reactors is turbulent. Besides the flow, the UV-intensity in the reactor needs to be calculated as well. This was done in Matlab with a self-written code based on models described in literature. We use the multiple segment source summation (MSSS) model. With the use of these models the amount of radiation a ‘package’ of water receives while flowing through the reactor is calculated. By calculating this for a large number of particles (for instance 5,000) the UV-dose distribution in the reactor is displayed. By combining the kinetic model, calculating the conversion from substances as a function of the UV-dose, with the CFD-model, that describes the UV dose distribution through the reactor, the breakdown of substances in a UV-reactor can be forecast.

Experiments

The research focusses specifically on medicinal products, and made use of a group of 35-40 of such products. This set was complemented with pCBA (reacting specifically with radicals) and atrazine (a chemical well-known in literature). The medicines have been selected on the base of criteria such as occurence and persistence in the environment, analysing possibilities and diversity in chemical composition. The target substances were analysed with reversed phase UHPLC (ultrahigh performance liquid chromatography) or normal phase (HILIC) chromatography.

In the laboratory the kinetic model was validated in several types of water. Subsequently experiments in a pilot reactor were executed. For this a standard disinfection reactor (D130) of Van Remmen UV Technique was used, discharging ten times as low to reach the required oxidation UV-dose. This is normally the case with UV/H2O2-processes, for which hitherto no separate reactors have been built.

In the laboratory the importance of including the influence of the (bi) carbonate to the reactions in the model was shown. The model forecasts the demolition of medicinal products well, both for low pressure as for medium pressure lamps. The measured demolition of medicinal products in a UV/H2O2- pilot reactor was compared to the calculated demolition. It demonstrated that the influence of the water temperature should be included in the model as well. The validation shows that the CFD-model in combination with the kinetic model forecasts the conversion of most of the medicinal products in the UV/H2O2-pilotreactor correctly within a margin of 5 percent.

Reactor design

The effect of alterations in the reactor geometry can be calculated in the model as well. This concerns for instance the placing of the lamps, the distance from the lamp to the outer wall, the optimal speed profile and the distribution of peroxide. In that way a reactor especially optimised for UV/H2O2-processes can be designed. Such reactors are built by Van Remmen UV Technique. At first an improved 1-lamp UV reactor, D200 (1 cubic metre per hour) and then a further optimisation resulting in a 4-lamp UV reactor, named NEW (10 cubic metres per hour). Subsequently it was reviewed which conversion is achieved using the same amount of energy. For the D200 reactor as predicted an improvement of 20-30% could be reached in conversion. For the second reactor the forecasted further improvement of about 10 to 20 percent was proven right. This means that by using optimized reactors, the same conversion can be reached at an energy level decreased with 30 to 40 percent. This makes the application of van UV/H2O2-processes for demolition of organic micro pollutants in practise much more interesting.

The model can be extended to make it applicable for other (more advanced) oxidation processes or water matrices. With that it can also apply to the treatment of other types of water, such as communal or industrial waste water. By optimizing the processes and/or reactors a much higher efficiency can be reached here as well.

Bas Wols, Roberta Hofman-Caris, Erwin Beerendonk, Danny Harmsen
(KWR Watercycle Research Institute)
Ton van Remmen
(Van Remmen UV Techniek)


Summary

In commission of the drinking water companies and in cooperation with Wetsus, KWR Watercycle Research has developed a forecasting model for the demolition of organic micro pollutants in a UV/H2O2-reactor for different water compositions. This model comprises two parts: a kinetic model that forecasts the conversion as a function of the UV-dose, and a CFD-model, that calculates the dose distribution in the reactor.

Validation of the total model in a pilot reactor shows that the model produces accurate forecasts regarding the processing of organic micro pollutants in the reactor. The model can forecast the influence of certain circumstances on the conversion of the micro pollutants. This will optimize the conditions leading to a minimal energy use at a guaranteed conversion rate.

The model was additionally used to improve the design of the UV/H2O2-reactors. Experiments in such reactors show that an equal conversion can be made with 30 to 40 percentage energy use reduction.


Literature


Liu, D., J. J. Ducoste, S. Jin and K. Linden (2004). Evaluation of Alternative Fluence Rate Distribution Models. Aqua - Journal of Water Supply: Research and Technology 53(6): 391-408.

Ter Laak, T., B. Hofs, C. de Jongh, B. A. Wols and C. H. M. Hofman-Caris (2011). Selecting relevant pharmaceuticals and metabolites for monitoring, risk assessment and removal efficiency studies, version 1. BTO 2011.100(s).

Wols, B. A. and C. H. M. Hofman-Caris (2012). Review of photochemical reaction constants of organic micropollutants required for UV advanced oxidation processes in water. Water Research 46(9): 2815-2827.

Wols, B. A., C. H. M. Hofman-Caris, D. J. H. Harmsen and E. F. Beerendonk (2013). Degradation of 40 selected pharmaceuticals by UV/H2O2. Water Research 47(15): 5876-5888.

Wols, B. A., D. J. H. Harmsen, E. F. Beerendonk and C. H. M. Hofman-Caris (2014). Predicting pharmaceutical degradation by UV (LP)/ H2O2 processes: A kinetic model. Chemical Engineering Journal 255: 334-343.

^ Back to start

MEDICINES

Degrading with less energy use

Knowledge section / Edition 1 / 2015

The Sand Motor is running

Coastal maintenance: without our intervention, the Dutch dune coast would be eroding constantly, partly as a result of the continuous sea level rise. But is frequently adding sand efficient? Could better solutions be found from an ecologic point of view? To find that out, the experiment with the Sand Motor was started at the coast of South-Holland. What are the results?

To keep the coastal line in place, Rijkswaterstaat (Netherlands Ministry of Infrastructure and the Environment) regularly brings sand from the deep North Sea seabed onto the beach or the shallow foreshore: coastal nourishments. In current practise this adds up to 12 million cubic metres yearly for the entire Dutch coast, typically about 1 million cubic metres at a time, distributed over a narrow strip of a few kilometres along the coast.

It is an established way to keep our coast in place and in good condition, however with disadvantages. The deeper shoreface is not supplied with sand, although it is retreating. As a consequence, the coast is getting steeper and more vulnerable to erosion. Also, nourishments need to be repeated every three to five years. In this process all soil life is buried under the sand. By the time the ecosystem has recovered, the next nourishments is scheduled. And then there are costs involved. The contractor has to mobilize his dredging material over and over again.

The question is: is it possible to redesign these nourishments in such a way that not only the disadvantages are removed, but also other goals (such as nature and recreation) can be served, maybe even with the help of nature itself. Building with nature, so to speak.

The Sand Motor

The Sand Motor is a large-scale coastal maintenance experiment meant to find out whether mega-nourishments – applying large amounts of sand (in this case about 20 million cubic metres) concentrated in time and place – could be a way to achieve these goals. In this experiment temporary new land, a dune lake and a tidal lagoon arise, offering additional space to nature and recreation.
Ever since the beginning of the experiment waves and tide have been spreading the sand along the coast. Since its construction in 2011 the Sand Motor is continuously changing and in the end will be assimilated in the line of beach and dunes between Hook of Holland and Scheveningen. It is intended that in this course no other nourishment will be needed for the next twenty years.

As the Sand Motor is still rapidly changing, it is not yet possible to definitively determine whether the set goals will be reached. Observations indicate that all is going the right way.

Natural dune increment

To be resistant to dune erosion the range of dunes must contain of a sufficient amount of sand. Keeping this safety buffer is an important goal for coastal maintenance. With the Sand Motor 20 million cubic metres of sand were brought into the system. Together with some earlier additional nourishments (1.5 million cubic metres) and recent reinforcement activities applied to the Delfland coast, this should produce a dune volume sufficient to cope with dune erosion for 50 years. At the moment a new strip of dune at the seaside of the existing front dune develops, but the sand drift to the back-dune area is a slow process. Therefore it cannot yet be established whether this goal will be reached.
According to the applicable rule for coastal erosion at sea level rising: at a rise of 30 centimetres per century (one and a half times as much as today) finally 15 to 20 percent of the applied sand should contribute to coastal accretion. In view of the observations so far and experiences with former nourishments, this seems an achievable goal.

Coastline enforcement

Another important goal of the Dutch coastline maintenance is enforcement of the so-called base coastline (that has been legally defined). In the next twenty years the placed amount of sand should provide in the enforcement of the base coastline. On account of comprehensive measurements of the soil situation, among others from jet skis, it could be determined that two years after construction approximately 10 percent of the placed sand was moved, largely to elsewhere on the Sand Motor. This is in line with the development derived from model predictions. If this is extrapolated, the entire placed amount of sand would come to move one time in twenty years. So it will take minimally twenty years for the natural processes to divide the sand along the coast. It will currently remain the question whether that distribution will occur in such a way that in those twenty years no nourishment will be needed anywhere between Hook of Holland and Scheveningen.
The seaward border of the Sand Motor is developing as predicted: quickly a natural bell-shape arose, of which the top gradually is becoming less pronounced and the foot is extending further and further alongshore. In the first stormy year this process seemed to be progressing faster than the models had predicted – based on general storm conditions- but in the longer run the forecast appeared to be according to reality. That inspires confidence in the possibility to timely foresee an eventual necessity for an additional nourishments.

Coast foundation

The sand of the Sand Motor is also intended to reach the deeper shoreface (the coast foundation) in such a way that it will adjust to the rising sea level. As a part of the monitoring program, especially in the framework of scientific research programs, the water and sand movements in deeper water around the Sand Motor are measured too, in order to determine to what extent the targeted nutrition of the deeper shoreface is occurring. Here the issue is again the relatively slow processes of which at this point the picture is not yet unambiguous.

The Sand Motor in July 2011, immediately after construction
Photo: Rijkswaterstaat/Joop van Houdt


Situation in September 2014
Photo: Rijkswaterstaat/Joop van Houdt


Ecosystem

A secondary aim of the Sand Motor is ‘developing natural values for foreshore, intertidal area beach and dunes’. A disturbance of the underwater ecosystem that is on balance less than that of the usual nourishment practice would be a major natural value for the project. The initial indications are positive: the quantity and diversity of bottom dwellers and fish in the area have increased. A thorough analysis of the obtained measurement data, however, is time consuming, so definite conclusions are still some time away.
At the higher part of the Sand Motor young dunes are developing with the associating pioneer vegetation, such as sea rocket.
The Sand Motor is a resting and foraging place for birds and sea mammals: large numbers of birds are dwelling there, like cormorants and several sorts of seagulls, and also many seals choose the Sand Motor for their resting place. The tidal lagoon functions as a breeding ground for large numbers of young fish and shellfish, but when the lagoon diminishes in the course of time, this function is expected to decrease too. As was to be expected a brackish water environment is developing in the enclosed lake, under the influence of rainfall, salt spray and salt leaching from the surrounding sand.
Whether ‘broader, more robust dunes with more space for dynamical management for higher natural values’ will come to existence is not yet to be established, because the slow process of the sand drift into the dune area.

Recreation

The Sand Motor is attracting beach hikers: on heydays it is full of people. The lagoon is a sheltered boarding place for (kite)surfers too, the Sand Motor is now recognised as kite surfer’s paradise. Whether in the dune area ‘more space for extensive recreation’ will come to existence as described in the goals cannot yet be determined as the processes in the dune area need more time to develop.
In this dynamic area risk management concerning recreational users is of course an important consideration. The Sand Motor changes the coastal currents, which could lead to dangerous rip currents for swimmers. A special app gives lifeguards access to the results of an operational model system, that based on recent soil measurements and actual tide conditions continually indicates where to expect dangerous currents. This information is used to detect potential dangerous situations as well as for alerting swimmers.
As expected behind the outer edge of the Sand Motor a trench formed through which water flows to and from the lagoon at each tide. In the beginning the flow velocity could become dangerously high here, but now that the trench has lengthened , the flow rate has decreased and a larger part of the lagoon water is refreshed over the intertidal beach.

Conclusion

Although the Sand Motor is a unique experiment, a more or less comparable situation formed its inspiration. In 1999 a large sandbank, the Born Reef, got connected to the west coast of Ameland. A situation similar to that of the Sand motor occurred, with a tide lagoon and a progressing spreading of the sand alongshore. There as well a meandering trench developed, which filled up with sands as during the years the bank spread further and further alongshore. The same fate lies ahead of the Sand Motor, so that in the long term only a memory of kite surfer’s paradise, a lot of new knowledge and a few metres of progradation of the coastal reach between Hook of Holland and Scheveningen will remain.
As far as presently can be established, the Sand Motor meets the larger part of the expectations or can be assumed to achieve this in the long term. Anyhow, the Sand Motor is a unique experiment regarding innovative coastal management. The project has attracted a broad international interest with visits from many foreign delegations in the past few years. At various places around the world similar measures are considered.

Huib de Vriend en Jaap van Thiel de Vries
(Foundation EcoShape, Building with Nature)
Carola van Gelder en Carrie de Wilde
(Rijkswaterstaat - Directorate-General of Public Works and Water Management)

Background picture: Foreshore replenishment
Photo: Royal Boskalis Westminster


Summary

As an immediately visible element alongside the Southern coast of the Netherlands, the Sand motor raises questions: ‘What is the use of this?” and ‘What consequences will it have’ or ‘Is it effective?’. The currently available data show that the Sand motor is developing in line with the expectations. The sand is spreading alongside the coast and the dune growth is manifesting. The development of vegetation and young dunes is developing slowly, but in ecological view all kinds of interesting things are happening. The growth of the sand bars is starting to manifest. The Sand motor has become an attraction for recreational beach users and kite surfers and an icon project for experts all over the world. The extent to which slower processes such as the nutrition of the deeper underwater banks and the recovery of the underwater ecosystem will occur as expected will subsequently become apparent.


Literature


DHV (2010a). MER Construction and sand production Sandmotor Delfland coast (in Dutch) Commissioned by Province South-Holland.

DHV (2010b). Monitoring- en evaluation plan Sand motor. Commissioned by Province South-Holland.

Linnartz, L. (2013). The second year Sandmotor: environmental developments at a dynamical part of the Netherlands. Foundation Ark.

EcoShape (2012). Building with Nature: thinking, acting and interacting differently.

^ Back to start

SAND MOTOR

What are the results?

Knowledge section / Edition 1 / 2015

The Human Sensor: a smart way to use data

To increase our grip on the production and distribution of drinking water progressing amounts of data are being collected. Should we keep continuing this way of working? Or could the available data be used in a better way? And how can the input of our own clients be used? The business software tool The Human Sensor improves the use of business data and client (human) data to optimize management processes and improve the client communications.

The demand for intelligent drinking water supply that generates reliable and actual information on the base of which we are ensured to make correct decisions is increasing. It is not just about the availability of data and information, but also about the way in which it is presented: accessibility. The technicians, the call centre employees and the client too should be able to understand the available information. However, there is a variety in information need and knowledge level of each user.

Human Sensor graphical platform

The explosive amount of data requires this process to be automated and the information to be made available through an easy accessible (graphical) interface specified for each user. This requires a solid perception of the information request and the business processes. The information provision can be improved by usage of the data of third parties (such as clients) complementary to the own data.
A good (computerised) information provision is desirable for various other reasons as well. After all, it is a genuine risk that in the near future insufficient qualified personnel can be available to analyse the increasing data stream. A different (integral) approach is necessary to effectively manage this data stream.

The Human Sensor

Based on this principle the concept of the Human Sensor was developed, with a focus on maintenance, malfunction and calamities in the distribution network as well as on client communication. This development has been initiated by the water company PWN of the province North Holland in cooperation with four other drinking water companies (Oasen, Vitens, Brabant Water and Evides Watercompany).
Every day clients contact water companies submitting complaints on quality or malfunction in the delivery of drinking water. The client is usually the first to notice the failure, very often before the drinking water company is even aware of any problem. This client contact is the first step in a complicated business process to find the cause of the complaint and solve it, for instance by repairing a leak.
Challenging here is: what are we trying to find and what exactly are we looking for? When a client reports a fountain of water in the street, the problem is evident. But more often it is not that simple, like it is the case with quality problems. Solving such problems demands effort of many people: the client submitting the complaint, the client contact centre registering the complaint (initially without any idea about the nature of the problem) and the maintenance team starting the search for ‘something’ somewhere. When successful, the maintenance team will give feedback to the client contact centre, that will in turn inform the client.

Collect data

The Human Sensor collects available data on abnormalities regarding quality and quantity of water and water pressure, such as scheduled and non-scheduled maintenance and malfunctions in production. These data are enriched with Twitter-notifications (related to the malfunction in the water supply) and the information from the client contact (complaints through email, telephone conversations and online notifications). The Human Sensor converts these data into practicable information, that can be used as input for geographical presentation and hydraulic calculations, such as backtrack algorithms to determine the most likely cause and location of a leak or contamination.
The information is directly – real time –graphically presented indicating the most probable place and size of the impact of the drinking water malfunction. The scheme graphically shows how the available information is combined in the Human Sensor. The (graphical) data presentation takes the information needs of the individual user or users group into account. Although used data and information sources are equal, the presentation shows only information and data that are relevant to the user concerned.
For the development of the Human Sensor all relevant data streams and business processes have been analysed: which data are available, which are usable, how can these data be accessed? Each business process (complaint handling, alarm, maintenance order) is important and how can the Human Sensor contribute here.

The Human Sensor shares relevant information with four different user groups. (1) the client, (2) the client contact centre, (3) the maintenance teams and (4) the central water dividers.

After the development of the graphical interface (ArcGIS) per data stream/business process a use case (description of the system functionality) has been drawn. These use cases are extensively discussed with the end-user and the IT-architect. Much attention was paid to the way of presentation: can relevant information for each user be found in accessible way for him/her? Subsequently each user case formed the basis to gradually develop, test and implement the functionality.
An extraordinary element was the client’s data stream. By means of e-mails, telephone calls, online visits and Twitter a new data stream has become accessible that is very important in the detection of the cause of a malfunction. The client is becoming an extra (human) sensor, improving the business of complaint processing. Client information is actively used in the Human Sensor to find the cause of the complaint. In that process the client is becoming part of the business process which is a very interesting development.
During the use of the Human Sensor it has furthermore become apparent that the quality of the shared data and information is improved, resulting in an improvement of the internal communication between the many departments involved. Using the same graphical platform stimulated a ‘parallel’ communication line. An important side effect that improved the mutual exchange of information between the different departments involved. Increasing the understanding of each other’s business processes made the use of information back and forth comprehensible. By (small) adjustments in the input of data the quality of the data and the mutual communication improved significantly.
In the development of The Human Senor the use of the same data and one interface improved the communication between the different internal departments of a company. The increased understanding of each other’s procedures, data and information demand improved business processes. The graphical platform has additionally become a breeding ground for new ideas, starting from the principle: ‘but if this is possible, this should also be..’

Conclusions

The development of the Human Sensor has shown that the usage of available data and especially data of third parties (clients) is (preliminary) reducing the need for more data or more sensors. Investing in better access and usage of already available data pays off.
An extra dimension is the use of client data, functioning as an extra ‘soft’ sensor and providing a complementary data stream, that improves the analysis of the cause of the complaint, but is also assisting in improving the quality of information to other clients. Besides this, the Human Sensor improves the client satisfaction.
Mapping data and information requirements per user provided better insight in the (quality of) business processes. Important here was the direct contact between end user and IT-architect. The platform has the ambition to share more data and information, to further improve the total business process. A critical success factor was the joining of domain knowledge (in this case drinking water), insight in business processes, attention for client perception (client intimacy) and IT-knowledge that resulted in the success of the Human Sensor.

Rob Schotsman
(Royal HaskoningDHV)
Harry Buyten
(PWN)
Ignaz Worm
(Isle Utilities, formerly PWN)


Summary

To increase the understanding of the performance of the drinking water supply, more and more data are being collected, often by placing new, valuable sensors. The question arises whether more information could be available in current data than immediately visible. Does a graphical interface improve the accessibility of this information? Does a smarter use of available data generate much more information? Especially when client data such as phone calls, tweets, e-mails etcetera are being used? The client becomes an extra (human) sensor who reports malfunction, calamities and such. That is the starting point for the business software tool The Human Sensor.

By optimal use of available data and client data, combined with a graphical platform, the access is strongly improved. The Human Sensor has proven that collecting more data and placing more sensors is not always required. By creating a better understanding and improvement of the business processes The Human Sensor stimulated the cooperation between departments. A valuable additional return.

^ Back to start
HUMAN SENSOR

Smart way to use data

Knowledge section / Edition 1 / 2015

Blue Energy promising for the water chain

Blue Energy, energy generated by mixing fresh and saltwater, has been well reported. At the end of last year, King Willem Alexander opened a pilot plant on the Afsluitdyke. Great interest is shown from abroad as well. Blue Energy: how does it work exactly, what are the possible applications and what is interesting for the water sector?

During the process of fresh water flowing into the sea, within moments a spontaneous mixing of fresh and salt water occurs. Saltwater contains a relatively large amount of charged particles (mainly Na- and Cl-ions). When freshwater and saltwater come into contact, the ions of the saltwater will move towards the freshwater. The instigator of this mixing process is the increase in entropy, in popular terms: the disorder of the system. The saltwater will gradually become more fresh and the freshwater more saline.
When this mixing process is occurring in an uncontrolled way – like in nature, or at a discharge – it is irreversible. By controlling the mixing process in a reversible way, a part of the energy that is otherwise lost, can be converted into electricity. In the Netherlands this has become known as Blue Energy. From mixing 1 cubic metre of freshwater per second with an equal amount of saltwater, theoretically and electrical power of 1.5 Megawatt can be produced. The energy density is comparable to a hydropower reservoir with a height of 150 metres.

From 2005, research institute Wetsus has gathered a consortium of universities, technology companies and end users together for research and development of the Blue Energy technology. The technology that was selected is called RED, Reverse Electro Dialysis. This process makes use of ion-selective membranes along which saltwater and freshwater are flowing. These alternately arranged membranes pass either positive or negative ions from the saltwater to the freshwater, creating a charge separation resulting in a voltage. Per membrane this voltage is circa 80 millivolt, enabling a stack of about 1,200 membranes to obtain 100 Volt.
The membrane stack is placed between an anode and a cathode in order to convert the ionic current into an electrical current. In this way, mixing energy is transformed into electrical energy. Both the membranes and the electrodes are key components, that have been developed further during recent years.

Research

Researchers’ first concern was to raise the power density – the power obtained per membrane area. From former literature it appeared that a lot of modelling with promising numbers had taken place, but the highest really measured power density was not higher than 0.41 Watt per square metre of membrane. In the past years the power density increased with a factor 5 when working with pure NaCl-solutions.
The next step was testing with artificial river and seawater: salt solutions with the same ion-composition as the natural fresh and salt water. It appeared that the density was reduced considerably with these ionic compositions, which was primarily attributed to other ions in the seawater (mainly the Mg-, Ca- and SO₄-ions). It was quite a surprise, however, to find that the composition of the freshwater had a large impact on the power density. While the Na- and Cl-ions were transported from saltwater to freshwater, the other ions present in the freshwater are actually transported in opposite direction. After this problem had been recognised, membranes were developed that are selective to single charged ions, reducing this contra productive process of ion exchange significantly.

Membrane development has been an important aspect of the research carried out by the University of Twente, necessary for decrease of the system’s internal electric resistance but also the hydraulic resistance and the fouling sensitivity. Membranes were developed with modified surfaces on which biofilms attach less quickly. Also membranes were developed with a profiled surface, to achieve optimal distribution, flow and mixing of the freshwater and saltwater. Besides, effort was made to decrease biofouling by varieties in operational measures.

A focus during the research phase was on the performance of the RED-technology, both in laboratory as in practice at the harbour and the salt factory of Esco in Harlingen. Based on these results the process design has been frequently adjusted. Now the time has come to practically test the developed technology in a large scale pilot and in long-term tests. The company REDstack together with Fujifilm, Magneto and several other companies connected to Wetsus – supported by the Province of Friesland and in close cooperation with Rijkswaterstaat (Dutch Department of Waterways and Public Works) – have realised a pilot installation on the Afsluitdyke. The pilot installation can mix 200 cubic metres of fresh lakewater from the IJsselmeer per hour with 200 cubic metres seawater from the Waddensea per hour. The pilot installation will be operational until the end of 2015.

Future large-scale applications will decrease the ecological impact of nowadays freshwater discharges by sluices at low tides as the freshwater in Blue Energy is pre-mixed with saltwater distributed over the whole day.
Freshwater and saltwater are primarily sieved and pumped through an installation. This takes place with a low flow rate. In this way, scavenging of larger organisms can easily be prevented.
Micro-organisms and small particles, however, will pass through the microsieves and will be carried along the membranes. Not only the effects of these particles on the achievement of the installation (fouling and growth on the membranes) but also the effects of the installation on these micro-organisms are part of the pilot research on the Afsluitdyke. A monitoring programme has been set up for measuring the impacts of the installation on the natural values.

Applications

The most obvious application of Blue Energy is the application as been described before, being implemented in the natural hydrological circle. For instance in places were freshwater is discharged or set out to sea, so at sea sluices or pumping stations. In the domestic and industrial water cycle the RED-technology can be applied when effluent is discharged in a receiving saline water body. Accordingly, water boards with wastewater treatment plants at sea can not only produce energy from the organic fraction in waste water, which is already been done, but in addition they can produce a comparable amount of electrical energy end-of-pipe.
Besides these applications there are less obvious possibilities in the water chain, for instance in dry areas in the world, and also for example on islands, being part of a desalination scheme. Saltwater desalination has a higher social acceptance than high value water re-use, but due to high energy use it is much less sustainable. Still it is possible to combine the best of both options - low energy use and the acceptance of seawater as a drinking water source - by adapting RED.

Schematic representation of a Reverse Electro Dialysis (RED) stack for conversion of mixing energy in electrical energy (Blue Energy): C is a negatively charged cation exchange membrane, A is a positively charged anion exchange membrane.

Schematic representation of Reverse Electro Dialysis (RED) applied as salt exchanger where salts from relatively clean seawater are transported to effluent as pre-treatment of a desalination installation. The numbers are indicative for salt content in ppm, RO for Reverse Osmosis and HD for High Pressure pump.

The most simple way to decrease energy use of seawater desalination is to lower the salt concentration. Sometimes this is already done by taking in pre-diluted seawater near an effluent discharge.
Energetically (and regarding acceptation), however, it is much better to have this pre-dilution occurring by controlled migration of salt from seawater to fresh water, as in RED. With RED-technology as a ‘salt exchanger ’, salt is transported from seawater to effluent. The saltwater is not directly in contact with the effluent, so contamination with pathogens cannot occur from the effluent to the seawater that is a source for drinking water production.
For the water supply of islands, desalination can become a sustainable option with a higher social acceptance than direct re-use of effluent or other polluted waste water streams. The lower concentration of salt provides energy saving for the following desalination step with reverse osmosis (RO) and the thus generated energy can also immediately be applied to the RO pump. In principle it is possible to produce an energetic self-sufficient desalination system. The reduction of the salt concentrations at the end additionally diminishes the amount of problems regarding concentrate discharge.
Obviously this needs more research. For instance on the issue whether and how heavy metals and organic micro pollutants in this system would be transported from the wastewater to the seawater and if they would be detectable in the finally prepared drinking water after RO.

In scientific articles many other applications of RED – or related CapMix technology which is also developed at Wetsus on the basis of capacitive electrodes – are referred to for possible use in the water chain. Combinations with microbial fuel cells are described, where waste water treatment and electricity production could take place in one step.
Also concepts are mentioned with RED as application for conversion of heat to electricity by a synthetic salt gradient, or in which gas emissions are transformed into electricity through a salt gradient. Additionally the development of an energy storage system based on salt gradients with a central role for RED or CapMix is in progress.

Jan Post
Wetsus/AquaBattery
Joost Veerman
REDstack
Rik Siebers
REDstack


Summary

Blue Energy is promising for water boards situated at sea. With this technique of controlled mixing of freshwater and saltwater they can produce energy in amounts comparable to those collected from the organic fraction in waste water. During an extensive research phase, particular focus has been on the operation of the RED-technology, in the laboratory as well as at the harbour and in the salt factory of Esco in Harlingen. At the Afsluitdyke a pilot installation that can mix 200 cubic metres lakewater from the IJsselmeer with 200 cubic metre of seawater from the Waddenzee per hour will be operational until the end of 2015. Apart from energy production less obvious possibilities of Blue Energy in the water chain are indicated, for instance as desalination technology.


Literature


J.W. Post (Wageningen University, 2009)

P. Dtugotęcki (University Twente, 2009)

J. Veerman (Rijksuniversity Groningen, 2010)

B.B. Sales (Wageningen University, 2013)

D.A. Vermaas (University Twente, 2014)

E. Güler (University Twente, 2014)

Li, W., W.B. Krantz, E.R. Cornelissen, J.W. Post, A.R.D. Verliefde, C.Y. Tang (2013), Applied Energy, 104, 592-602.

^ Back to start

BLUE ENERGY

Interesting for the water sector

Knowledge section / Edition 1 / 2015

Softening more sustainable and cheaper with pure calcium carbonate granules

Drinking water is softened in reactors with sand and chemicals. In this process calcium carbonate granules (grains of sand with a calcium carbonate layer) are formed. This residue is used in the construction sector or in the agriculture. How sensible would it be to use plain calcium carbonate granules instead of sand as as seeding material? Then a more high value residue of pure calcium carbonate granules (calcite pellets) with more possibilities for re-use is created. The report of an investigation and the first positive results from practice.

In the Netherlands about 50 percent of the drinking water is softened in pellet reactors. In this process calcium carbonate granules are formed as a residue. These granules consist of a core of sand, the seeding materialand a peel of calcium carbonate from untreated drinking water (and possibly partly from lime milk). This residue is re-used as a resource in several sectors such as construction, agriculture, and mineral resources sector.
Replacement of the sand core by a core of calcite (calcium carbonate) produces a pure calcium carbonate granule (further called calcite pellets) consisting of one component. That offers possibilities for high quality production in for instance glass and paper industries, and increases the residue yield.
By grinding and sieving the calcite pellets could be re-used as seeding material in the softening process. This is to be preferable to mining and delivering from foreign marble grooves. Re-use and marketing of grinded calcite pellets can lead to a cost reduction at drinking water companies, an increase of sustainability at both drinking water companies and industry and contributes to the circular economy.
At Waternet, the water cycle company of the municipality Amsterdam and the water board Amstel, Gooi and Vecht, in cooperation with the Technical University Delft, the Reststoffenunie, KWR Watercycle Research Institute and drinking water companies Dunea en PWN, the possibilities of the re-use of calcite pellets as seeding material were investigated.

Pilot plant

The research started in January 2013 in the pilot plant of drinking water treatment plant Weesperkarspel (Waternet). Here two identical pellet reactors each with a diameter of 30 centimetres and a height of 6 metres were tested. The first reactor was filled with granite sand (with a density of 4.113 kilograms per cubic metre and a diameter of 0.25 millimetre), the second with calcite (with a density of 2.670 kilograms square metre and a diameter of 0.5 millimetre) as seeding material. In both reactors caustic soda was dosed as a softening chemical.
After the initial phase of one month enough calcite pellets had been produced, so that the pellets could be grinded to seeding material. Grinding the moist pellets appeared to be impossible because the granules sticked to the grinding machine. The pellets could be grinded if they were dried for at least 24 hrs in an oven on 100 degrees Celsius or entered with an overflow of water. In both cases it appeared possible to grind the pellets with a 1 millimetre diameter to seeding material of 0.4 to 0.6 millimetre with a grinding yield of 40 percent. The microbiological analysis initially indicated that dry and wet grinding is possible without contamination.
From the moment the reactor with calcite was filled with grinded calcite pellets as seeding material, the performance of the two reactors were compared. The operational parameters (bed height, debit, lye solutions, pellet drainage diameter) of both reactors were identical during the measurement period from mid-February to the beginning of April. In this period of time the water temperature was between 1 and 4 degrees Celsius and the hardness of the water 2,3 mmol/l. In this period the caustic soda solutions, the tap granule diameter and the reactor debit were varied to verify whether the softening reactors perform comparably under different circumstances for garnet sand and calcite (both commercial available calcite as grinded and sieve calcite pellets) as seeding material. This resulted in a variety of the total hardness in the effluent of both reactors of between 0,5 en 1,6 mmol/l. Based on the total hardness, pH, SI, theoretical calcium carbonate crystallisation potential (TCCP) and turbidity was not distinguishable in the operation of the reactor with garnet sand and grinded calcite.

Sustainability and expenses

What is the influence of applying pure calcite pellets on sustainability and expenses? To assess sustainability besides a pilot plant research the use of garnet sand, commercially achievable calcite and grinded calcite pellets on company scale (Weesperkarspel) are compared on the basis of a lifecycle analysis.
For this the software package Simapro was used which expresses scores in Eco Points: 1 Eco point equals 1/1000th of the total environmental impact of the average European. Garnet sand is imported from Australia, by shipment. Commercially available calcite is transported by truck from Italy. Local production of the grinded calcite pellets limits transportation.
The impact of the re-use of the pellets in other industries is determined by the substitution of the raw material these industries use. Pellets with a garnet sand core are substitute for the material sand. Pellets with a calcite core replace the higher value ground material calcite. Besides the ground material, calcite has a larger transportation distance than sand. By re-use of calcite pellets the industry can make use of the local calcite and does not need to import calcite from other countries. Thus the impact on the environment of Waternet and the total chain is reduced. The total profit achievable by turning from garnet sand to calcite pellets as seeding material is approximated on 10,600 EcoPoints. An environmental profit of 5 percent for the total refinement of the area of Weesperkarspel.
Besides this life cycle analysis a comparison has also been made with regard to the cost-benefit calculation of garnet sand, commercial calcite and grinded calcite. The costs were estimated to be 365 euro per ton for garnet sand, 150 euro’s for Italian calcite and 50 euro’s per ton for Dutch calcite (for grinding and sieving, inclusive of labour costs). The pellets with garnet sand core have no profit (net costs of 0) and the profit of the pellets with calcite core is calculated to have a net-proceeds of 15 euro’s per ton. The cost-effectiveness shows that for the refinement of Weesperkarspel the transition to grinded calcite has the highest yield, approximately 38,000 euro per year. This equals a reduction of the yearly operational costs of 0.5 percent.


Risk analysis

A Failure Mode, Effects and Critically Analysis (FMECA) was executed for the implementation of the usage of grinded calcite as seeding material at the entire refinement Weesperkarspel. At such an analysis all possible failing mechanisms of all process steps are identified and evaluated. The FMECA identified the hygienic aspects of storage, production and transport of the pellets and the seeding material as an important focus. The largest part of the risks could be covered by good monitoring during the starting phase and the disposal of sufficient back up plans.

Conclusions

From the comparable research carried out on pilot scale it appears that both the commercially available calcite and the grinded calcite pellets achieve comparably to the current garnet sand that is used by drinking water refinement. The part of the calcite pellets that is not yet produced to seeding material (approximately 90 percent) can be marketed in the Dutch industries.

For the drinking water treatment plant Weesperkarspel (Waternet) a cost-efficiency analysis showed that this can lead to an operational costs reduction of 38,000 euro’s (0.5 percent), and a life cycle analyse indicates a decrease of environmental impact of 5 percent. Re-use and marketing of grinded calcite pellets can lead to costs –savings at drinking water companies, an increase of sustainability at drinking water companies as well as at the industry and contributes to the circular economy.
Since January 2014 the refinement Weesperkarspel has switched to commercial calcite as seeding material. Mid 2014 a successful company scale test took place with the grinding and sieving of the calcite pellets and for several weeks the refinement has operated grinded calcite pellets as seeding material. At the beginning of 2015 a test with grinded calcite pellets as seeding material with critically low temperatures from winter water is scheduled. Additionally several initiatives for the realisation of high value marketing of the calcite pellets are running.

Marc Schetters
(ARCADIS, Waternet, TU Delft)
Jan Peter van der Hoek
(Waternet, TU Delft)
Eric Baars
(Waternet)
Bas Hofs
(KWR)
Hay Koppers
(Reststoffenunie)

This article is partly based on the Master study paper of Marc Schetters at the Technical University in Delft. The paper was nominated for the Waternetwerk Paper price 2014. Royal Dutch Waternetwerk yearly grants two prices for the best bachelor and master paper on a water related theme from a Dutch or Flanders knowledge institution. Papers are sent in by professors.
www.waternetwerk.nl

Background picture: Above right garnet sand (diameter 0.25 millimetres ) often used as seeding material, left above pure calcium carbonate granule (0.5 millimetre diameter) used in this research, and below the ‘residual material’: pure calcium carbonate granule (calcite pellets) diameter of 1 millimetre.


Summary

About 50 percent of the Dutch drinking water is softened in pellet reactors by dosing of softening chemicals and sand as seeding material. Processing a residue in the form of calcium carbonate pellets with a sand core (calcium carbonate granule). This residue is re-used as a raw material in several sectors. Replacing the sand core by a calcite core (calcium carbonate) leads to a pure calcium carbonate granule or calcite pellet. That offers possibilities for high value marketing in industries. By grinding and sieving the granule can be re used as seeding material. Research on the drinking water treatment plant Weesperskarspel showed that with the replacement of garnet sand as seeding material by grinded calcite pellets an environmental profit of 5 percent and a cost profit of 0.5 percent can be achieved, without negatively affecting water quality, even at temperatures critically low for softening (1 to 4 degrees Celsius).


Literature


L. Palmen, W. Oorthuizen, H. Koppers, B. Hofs, Calciet als alternatief entmateriaal bij ontharding produceert hoogwaardige kalkkorrel, H2O 2012, 45, 10, 35-37

M. J. A. Schetters, J. P. van der Hoek, O. J. I. Kramer, L. J. Kors, L. J. Palmen, B. Hofs and H. Koppers, Water Science & Technology, Circular economy in drinking water treatment: reuse of ground pellets as seeding material in the pellet softening process, 71.4, 2015 doi:10.2166/wst.2014.494

^ Back to start

WATER SOFTENING

More sustainable and cheaper

Knowledge section / Edition 1 / 2015

Forecasting the impact of a hurricane surge in a bay

Galveston City, a small city situated on a bay close to Houston, Texas, is vulnerable to hurricane storm surge. How does storm surge during a hurricane behave in a coastal bay? And how does the behavior of storm surge in coastal bays affect risk reduction strategies?

In September 2008 hurricane Ike made landfall near Galveston, a small city located about 30 kilometer South of Houston, Texas. Despite the obligatory evacuation orders, approximately one-third of the citizens decided to ride out the storm. A decision that proved fatal for 39 people. Hurricane Ike inflicted over 30 Billion dollars’ worth of damage in over ten States. Despite Ike’s major impact it could have been much worse, or as professor Bill Merrell of the Texas A&M University in Galveston once said: ‘As bad as it was, we dodged a bullet’.

The impact of landfall location on hurricane storm surge within a coastal bay

Ike’s tale is not a one-off story. Today’s metropolis such as New York, New Orleans and Houston often originate from historic port settlements. Initially thought to be located in safe areas, recent events such as hurricane Sandy (New York, 2012), Ike (Houston, 2008) and Katrina (New Orleans, 2005) clearly demonstrated the vulnerability of coastal settlements to flooding.
This article describes the results of a MSc. Thesis on the impact of hurricane landfall location on the probability and consequence of storm surge within coastal bays, such as the Galveston Bay. In addition, the study couples the results to an assessment of various risk reduction strategies for the Galveston Bay.

Galveston Bay

Galveston Bay is a semi-closed estuary system located on the Gulf of Mexico that is about as large as lake IJssel. Galveston Bay is separated from the Gulf by two barrier islands, Galveston Island and the Bolivar Peninsula. The bay is relatively shallow, has a high biodiversity and is an important economic driver for the region. For American standards, the region is densely populated (about 1.5 million people) and experiences rapid population growth. Port of Houston is located in the Northern part of the bay. The Port of Houston is the second largest port in the United States and a major hub for the oil and gas industry. The abundance of economic activities within close proximity of the bay shore combined with strong population growth, local geography and climate hints at a high vulnerability to coastal flooding.

In response to Hurricane Ike’s disastrous impact, several structural flood risk reduction strategies have been proposed. Some advocating local solutions, others advocating system-wide coastal barriers. An example of one of these system-wide strategies is the Ike Dike, a ‘coastal spine’ of levees on the barrier islands, spanning approximately 80 kilometers, complemented by a 3-kilometer wide movable flood barrier. An example of a proposed local solution is the Centennial Gate, a single flood barrier in the Houston Ship Channel, inspired by the Maeslantkering at Hoek van Holland.

Hurricanes and storm flooding

The Houston/Galveston region is among the most hurricane-surge prone areas within the United States. On average, one hurricane strikes the region every eight years. A hurricane is a tropical storm with wind velocities exceeding Beaufort 12. The highest wind velocities are located near the eye of a hurricane, that has a width of up to 150 kilometers. On the Northern hemisphere, hurricanes rotate counter-clockwise. Because of this rotational nature, a hurricane’s strongest wind field is located on the right side of the hurricane (with respect to the storms direction of motion). On the right side, the forward movement of the hurricane amplifies wind field, whereas at the left side the wind is slowed down due to the opposite direction of storm movement and wind direction.
Water level increase during hurricanes (also known as storm surge) in an estuary or bay is caused by both inflow from the ocean, and local wind setup within the bay. Wind setup within a bay is dependent on the wind direction and wind velocity during the storm. Inflow from the ocean is caused by flow through the bay’s inlet, and in case of severe storms also by overflow of the barrier islands. The magnitude of the inflow is determined by the difference in water levels between the bay and the sea and therefore depends on local wind setup within the bay.

Storm surge in a bay is a combination of inflow and wind setup within the bay

The figure above presents a schematic illustration of the Galveston Bay with a hurricane gradually moving ashore. A hurricane making landfall to the West of a bay forces water into the system, increasing the surge. In this particular case, the bay is exposed to the strong onshore winds located on the right side of the hurricane. Right before the hurricane makes landfall, the water in the bay is forced towards the West, on landfall to the North and after landfall to the East.
Hurricanes that make landfall to the East of a bay, force water out of the bay. The storm surge within the bay remains relatively small in this case.

This shows the sensitivity of storm surge within a bay to the landfall location of a hurricane. As hurricane Ike made landfall right on top of the Galveston bay, the bay was never exposed to the strongest winds on the right side of the hurricane. Had landfall been slightly further West, the maximum storm surge at the coast would have been combined with a strong northerly wind across the bay. This would have resulted in maximum wind set-up and Ike would most likely have flooded Northern parts of the bay, including the Port of Houston.

Hydrodynamic study

To assess bay behavior under hurricane forcing a simplified hydrodynamic model has been developed. The model consists of three components: a hurricane model, a hydrodynamic model for the water levels within the bay and a 1-D numerical model for storm surge at the open coast. The probability and magnitude of storm surge within the bay and at the open coast is obtained by simulating a large number of hurricanes making landfall at different locations along the coast.

Galveston Bay: a semi-closed estuary system of the size of the Ijsselmeer

To assess the benefits of the various flood risk reduction strategies an indicative cost benefit analysis was performed. Aided by GIS the results of the hydrodynamic model were coupled to the value of assets within the area. By applying generalized depth-damage curves an estimate of the damage as a function of the probability of flooding was obtained. A similar analysis was performed for a bay with measures such as the Ike Dike or Centennial Gate. By comparing both analyses an indication for the cost-effectiveness of risk reduction measures at certain return intervals was acquired.

Results and discussion

The study indicates that storm surge within Galveston Bay exceeds the storm surge at the open coast at least once per 50 years. Landfall West of Galveston Bay tends to result in the highest surges as Galveston Bay encounters the strongest winds in on-shore direction. Storm surge within Galveston Bay is a delicate balance between inflow and local wind set-up. Shortening the perimeter by building a barrier at the coast significantly reduces the inflow but may still lead to flooding due to local wind setup. Knowing this, it is advised to consider a combination of both coastline reduction and local measures within the bay.

The study indicates that investing in large system wide strategies, similar to the Dutch Deltaworks, is only cost-effective if one is willing to invest in a solution with a safety level according to Dutch standards. When a lower level of safety is desired, local solutions within the bay are definitely worth considering.
The risk analysis solely considered the direct economic impact of flooding. It is recommended to include other aspects such as loss of human life and indirect economic damage. In addition, one should consider the impact of flood risk reduction measures on the ecology of coastal systems.
The Dutch Deltaworks have shown that (partly) closing off estuaries may have considerable impact on the ecosystem of the areas behind the barrier. Considering the potential ecologic impact if barriers it is questionable whether a cost benefit analysis yields a positive result if the ecologic impact is included.

Whether Galveston is going to realize a flood barrier has not be decided. Currently an extensive study is being performed by several local organizations including local Universities and in cooperation with the Delft University of Technology.

Kasper Stoeten
(ARCADIS)
Bas Jonkman
(TU Delft)
Matthijs van Ledden
(TU Delft, Royal HaskoningDHV)
Arno Willems
(Iv-Infra)

This article is partly based on the Master Thesis by Kasper Stoeten at the Technical University in Delft. The Thesis was nominated for the Waternetwerk Thesis award 2014. Royal Dutch Waternetwerk yearly grants two prices for the best bachelor and master Thesis on a water related theme from a Dutch or Flanders knowledge institution. Theses are sent in by professors.
www.waternetwerk.nl


Summary

More than six years after hurricane Ike devastated the Galveston Bay Area, the most critical challenge remains; reducing flood vulnerability. In response to Hurricane Ike’s disastrous impact, several structural flood risk reduction strategies have been proposed. Some advocating local solutions, others advocating system-wide coastal barriers. The relationship between storm surge within Galveston Bay and storm surge at the open coast may profoundly affect the performance of these local or system-wide solutions. Preliminary results indicate that coastline reduction may be an effective solution for the Galveston Bay. Even with a coastal barrier, local wind setup within the bay may lead to flooding during storm events. It is therefore recommended to consider a combination of both coastline reduction and local measures.

^ Back to start
HURRICANES

Forecasting the impact

Knowledge section / Edition 1 / 2015

Is agriculture sensitive to saline water?

How well can crops take saline water? Water managers have applied conservative standards on salt tolerance in consultation with agriculture. However there are more and more indications that especially open field production can take salt (much) better than the standards suggest. Offering some great opportunities to make water management more flexible and less expensive.

The climate is changing and the water system is under pressure of conflicting interests. An important issue is the availability of enough freshwater and the increasing salinization in the Dutch lowlands. In regional water management the question for water with a salinity amount that is as low as possible is prompted by the fear for brackish irrigation water causing agricultural damage. However for years now several indications have shown that various irrigated open field crops are more resilient to higher salinities, in any case in certain periods of time, than accepted salt tolerances suggest. It is also indicated that it is better to accept salinity damage in favour of drought damage prevention. This would be good news for Rijkswaterstaat ( Department of Waterways and Public Works), regional water managers but for farmers as well. Especially in times of drought, it brings more flexibility and possibly less necessity to invest in measures against assumed salt damage.
In (and outside of) the Netherlands much knowledge is developed on salt salt tolerance data of crops, based on practical experiences and scientific research. This knowledge is applied selectively: the actual freshwater supply of Dutch areas sensitive to salinization is structurally on the safe side, region bound and regarding ‘standards’ not unambiguous. That can be explained. Under all circumstances water managers try to stay below ‘agreed’ salt thresholds and the users are satisfied with the service offered. Incidental salinity exceedance is accepted. The question is however: is this policy sustainable in future increasing freshwater shortage? And is it really necessary? Indeed: to what extent is salinization of irrigation water for crops in the open problematic?

Surprised

Currently there seems to be no salt damage regarding these crops. Notifications stay absent and recent signals from the Dutch Salt Farm Texel point in that direction too. Researcher De Vos: ‘regularly we are surprised by the salt tolerances here. It differs per crop, but many of the potato races tested by us are for instance factor 2 or 3 more tolerant to salt than the Dutch standard is presently calculating. However, the Salt Farm Texel does not (yet) support this statement with public data.
Lately farmers have indicated more often that they could not determine damage to their crops after irrigating using water that was significantly more saline than the currently established ‘ standards’.
They have successfully prevented drought damage. As far back as in 1987 the former agriculture consultant Huinink stated: ‘the main question is: what is more significant, the current drought damage or the salt damage caused by irrigation. That drought damage is indeed a factor larger than salt damage is commonly known. Farmers who in dry circumstances stop irrigating soon because they fear crop damage by salinization leave themselves short.
Farmer Werner Louwerse (Walcheren) has found out how to handle freshwater scarcity. In dry periods he irrigates without noticeable damage, sometimes forced to use brackish water (more than 2,000 milligrams chloride per litre). Also in Flevoland open field cultures are irrigated with water with 1,500 milligrams per litre, apparently without problems.

Inventory

We have made an inventory of reports and literature of reported salinization thresholds in irrigation water grafted onto the Dutch situation. According to the authors that have published these thresholds from the forties of the last century onwards, higher salinization leads to crop damage. These inventories show large differences. Salt-tolerant open field crops show the most significant differences: sugar beets between 600 and 7,800 milligrams of chloride per litre, wheat and barley between 600 and 6,300 milligrams and potatoes between 200 and 5,000 milligrams.
In case of moderate tolerant open field crops the differences are significant too: corn between 200 and 1,200 milligrams, and onion, endive, celeriac, leek, carrots and chicory between 300 and 5,000 milligrams. The tolerance thresholds for ‘salt sensitive crops’ (fruit trees, horticulture, radices, pies, beans, peppers, tomatoes, cucumber, lettuce, etc.) are rather consistent and not disputed.
The threshold values in the first two groups (salt tolerant and moderately salt tolerant) appear to be less relevant than those in the ‘sensitive’ group. In the first place because in daily practise a minimal salinization of irrigation water is unavoidable. But – no less important – because it still is the question to what extent cultures in these groups are exposed to dangerously high salinity levels. This has already been questioned half a decade ago.
Since its institution in 1956 the Wageningen Institute for Land and water management research (ICW) has investigated the salt tolerance of horticultural crops. Attention to salt tolerance of crops in open fields was considered unneessary as problems were not reported. In a report on the occasion of its 10th anniversary ICW (1967) stated why: Precipitation during the winter period (200 millimetres) is sufficient for leaching the concentration of salt formed during the former growing season out of the soil. Most crops and some horticultural crops grown in open fields will not have to deal with dangerous salinization problems because the salt tolerance is high and the increase of the salt level of the soil water at field capacity is low.
In other words: root zones are hardly ever becoming ‘too saline, and if they do it is generally for a short period of time, because rains will wash it away. This observation has become even more relevant because of the trending and significant increase of the amount of rain since then.

Modelstudy

Now suppose the salt tolerances of irrigated open field crops would be twice as large as is actually assumed. What would that mean in a business economic sense? To get a good impression of this, an exploratory model study has been carried out. Per water board/ region in Dutch lowland crop yields are calculated with the standards of 2013 and with increasing tolerances.
The outcome was that an assumed doubling of salt tolerances leads to a decrease of the salt damage with 59 million euro per year. Although this may seem a significant amount of money, it is only 3 percent of the total crop yield in low Netherlands (1.7 billion euro). Reversely, this result means that the salinity of irrigation water may be doubled in many cases to reduce effectiveness to the 59 million salt damage reduction. A remarkable result that raises the question why our rigid ‘salt tolerance standards’ could not be more relaxed.
Through a large number of water agreements in the course of years arrangements have been made on the efforts water managers should take to desalinate the water as much as possible. Accepting higher chloride numbers in irrigation water offers opportunities for a more efficient and more flexible water management, with no or hardly any negative result for farmers and in times of drought even preventing damage.
When farmers believe the risks of more saline irrigation water are too high for their business, they take their own measures, as is done in the greenhouse (horticulture) sector. Without precedent and remarkable is the development concerning the freshwater refinement of Tholen and Sint-Philipsland. In 2013 here farmers and the water board Scheldestromen made concrete agreements on freshwater supply at costs. 80 percent of the farmers pay for irrigation water with a maximum chloride amount of 750 milligrams per litre with a maximum of 32 euro per hectare per year.
The salt tolerances of irrigated open field crops and their effects are structurally indicated too pessimistically. It would not be logical to continue neglecting this. In this domain there is a knowledge paradox: much knowledge has been developed that is (too) little applied and not transferred to policy, law and regulations.

Wicked problem

Apart from developments regarding freshwater supply of Tholen and Sint-Philipsland it seems an illusion that the salt tolerance of crops will be questioned by the sector and the water managers themselves. The freshwater supply of soil-bound crops has the characteristics of a wicked problem: a problem with large impact and uncertainties. Definition and delineation of the problem are complex and part of the problem itself. For finding solutions instruments and methods are needed that lead to mutual understanding and commitment; and all involved parties should have to make concessions towards their interests and standards
One of the conclusions of the fresh-salt congress in Burg Haamstede mid 2014 was that the existing gap between practise, knowledge and operational management should be reduced. Farmers and water managers can than more easily reconsider their view on salinization.
Anno 2015 there is a large need for a knowledge coproduction route. That should facilitate a process in which the Ministry of Waterways and Public Works, regional water managers, the sector and knowledge institutions act together towards an assessment framework.
For a good connection between science and practice Communities of Practice are important instruments. All knowledge and understanding about the discussed file should preferable be collected in a joint knowledge infrastructure, i.e. ‘ Knowledge Table Fresh-Saline. In the fall of 2014 Alterra Wageningen UR, Foundation Applied Science Water management (STOWA) and Ministry of Waterways and Public Works have made the first steps to achieve this.
Essential for such a Knowledge Table: acting together, connecting each other’s realities and mutually agree. Knowledge from practise and scientific knowledge are the joint starting point: scientists and practitioners should agree on the principles. Each participant joins from his or her own reality to get connected to the other participants. It is important to establish (new) knowledge and insights in a joint basis and from there move on further together.

Lodewijk Stuyt
(Alterra Wageningen UR)
Neeltje Kielen
(Rijkswaterstaat – Water, Verkeer en Leefomgeving)
Rob Ruijtenberg
(STOWA)


Summary

For decades now a growing number of signals show that certain field crops like potatoes, barley, wheat, sugar beets are (much) more tolerant to saline irrigation water than is assumed by water managers. The effects of salt are structurally indicated more pessimistically than necessary. A larger salt tolerance can offer water managers flexibility and reduce expenses. That is a good thing in a changing climate, changing economic interest and with a view to the increasing salinization of Dutch lowlands.

The current fresh water supply of salinization sensitive areas in the Netherlands is playing safe, region bounded and according to standardisation not uniform. For finding solutions instruments and methods are necessary that lead to joint understanding and commitment, and all involved parties must do concessions to their interest and / or values. A ‘Knowledge Table Fresh-Salt’ would contribute to that goal.

^ Back to start
SALINE WATER

How well can crops take it?

Knowledge section / Edition 1 / 2015

Dutch Freshkeeper broadly applicable

In the past decade several concepts to manage fresh and salt (brackish) groundwater more effectively and so improve the fresh water supply in delta areas have been developed. One of those concepts , the Freshkeeper, is also in focus internationally. Through public-private cooperation between KWR, Vitens, De Ruiter and ARCADIS this concept will in future be applied to coastal areas around the world.

Water, for use as drinking water, by the industry, and in agriculture, is scarce in the Dutch lowlands. That is due to the small amount of fresh groundwater in the mostly brackish subsurface. This is noticeable for instance in the dunes, where a large part of the drinking water of West-Netherlands is produced. Already since the 1950’s of the last century surface water is infiltrated in the dunes to complement the freshwater bell and prevent groundwater salinisation.
Groundwater production in the northern, middle and eastern part of the country are vulnerable too, due to fossil brackish water in the deeper soil. In 1993 drinking water company (later becoming) Vitens had to close the northern well field of groundwater supply Noardburgum (Friesland) because brackish groundwater was flowing to the freshwater abstraction wells. At that time no other solution was available.
As a solution for salinisation of the groundwater production the idea of the Freshkeeper was developed early 2000. The principle here is that not only fresh groundwater is abstracted, but with a separate filter screen also the upconing brackish water. In that way the fresh-saline interface is stabilised, preventing salinisation of the fresh filter screen. The brackish groundwater can be disposed, for instance by injection into deeper aquifers, but it can also serve as an additional source for drinking water after desalination with reversed osmosis (RO). So theoretically it is possible to even enlarge the total production of a salinised well field, by using the fresh as well as the brackish water.

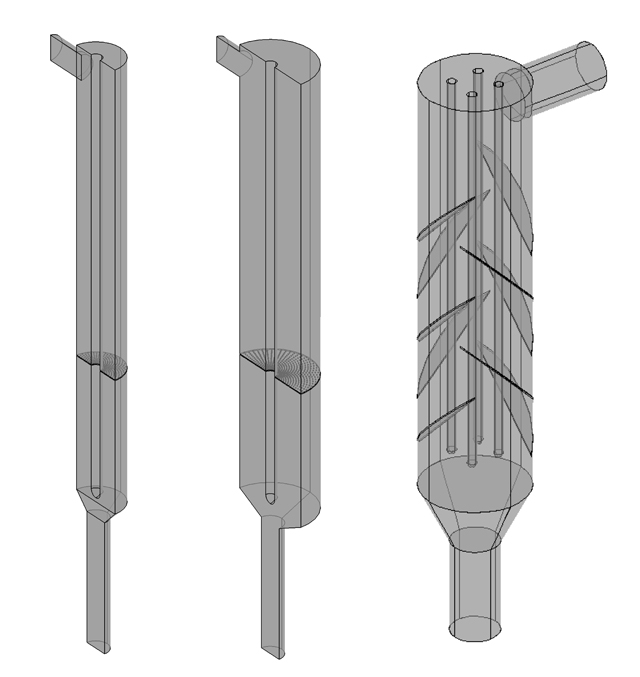
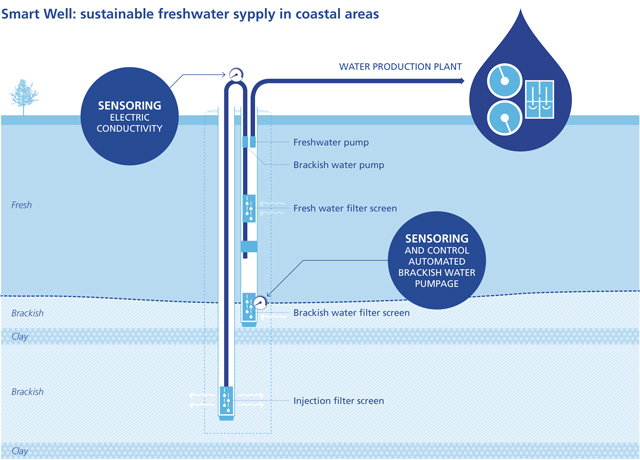
The smart Freshkeeper well of Noardburgum

Practical field test

This Freshkeeper combined with brackish water RO was applied during a practical field test in the northern well field of Noardburgum in 2009 and 2010. Through the fresh as well as the brackish filter screen a fixed discharge of 50 cubic metres per hour water was won. The Freshkeeper was installed to stabilize the fresh-brackish interface, but with the configuration that was selected locally this interface was even pulled down. That became apparent from the decline in chloride concentrations in the several observation filters.
This downconing was acknowledged by calculations with Seawat, a density dependent groundwater flow model. Scenario calculations showed that the extraction of 16 cubic metres per hour from the brackish filter screen should be sufficient when from the fresh filter screen 50 cubic metres per hours is won.
At the same time Brabant Water experimented with brackish water as a source for drinking water as well. Both practical tests provided much knowledge on the disposal of membrane concentrate through injection in below brackish aquifers. Concentrate is a residue of desalination and its disposal is an obstacle in the breakthrough of brackish groundwater as a freshwater source. In Noardburgum the concentrate injection appeared to be easily implemented, especially because of high iron concentration that disturbed calcite precipitation. Calcite precipitation did cause obstruction of the injection wells at Brabant Water, but this could be solved effectively by adding the weak acid CO2 to the concentrate.
Conclusion of the practical test at Noardburgum in 2009 and 2010 was that a relatively large abstraction of brackish water against the abstraction of freshwater had even realised a freshening of the groundwater system. That made evident that a further optimisation of the Freshkeeper was possible.

Optimization

This optimization is taking place within the TKI Watertechnology-project Keep It Fresh!. Vitens, De Ruiter Grondwatertechniek (formerly BAM Nelis de Ruiter) and KWR are cooperating on the development of a ‘smart well’. In this Freshkeeper-well two abstraction filters are located in a depth of 60 metres (fresh groundwater) and 140 metres (brackish groundwater). The brackish water is pumped up at the same time as the fresh water, but subsequently injected on a depth of 170 metres under a confining clay layer. The smart part is in the measurement and control technology. The well itself determines, based on online measurements of the salinity of the groundwater, how much groundwater is pumped. In this way the energy costs for the disposal of brackish groundwater can be minimalized while the freshwater production remains fresh.
The smart well has shortly become operational and will be tested extensively in 2015. Not only regarding the technical functioning of the well itself, but also with respect to the reaction of the groundwater system on different abstraction regimes of fresh and brackish groundwater. The produced information will be used to develop a good density dependent groundwater flow model and for selection of the decision making rules to full automatically manage the well. This knowledge is supposed to be the prelude to a full scale application of the Freshkeeper concept an re-opening of the northern well field of Noardburgum that was closed in 1993.

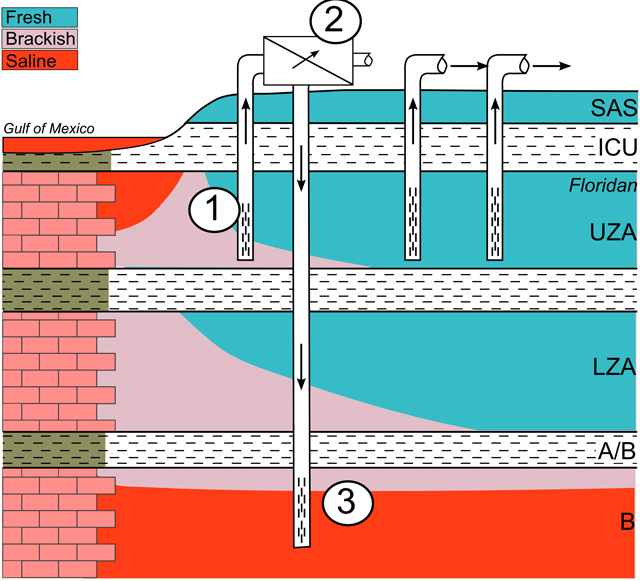
Scheme of possible applications of the Freshkeeper in Florida.
The freshwater wells inland are protected by interception of the intruding seawater (1). The intercepted water is desalinated with reversed osmoses (RO ) (2), after which the membrane concentrate is disposed to the underlying aquifer.


Export

The idea of the smart well was conceived by Vitens and further implemented with both project partners. The control and measurement technology of the well is for a larger part developed by De Ruiter Grondwatertechniek, KWR brings in knowledge of density dependent groundwater flow. De Ruiter foresees many opportunities for the application of the concept outside of the Netherlands. Salinisation is a global problem and Freshkeeper is a, essentially simple, solution that is also applicable elsewhere in Europe or in the United States. It is a challenge to apply the innovation in countries that are less developed regarding control and measurement technology such as Indonesia and Suriname.
Export chances might occur in short term. In the past year ARCADIS, KWR en Vitens have executed feasibility studies in the US, additionally supported by the Dutch Climate Changes Spatial Planning Programme. The studies were commissioned by two water companies in Florida, also experiencing salinisation of their drinking water production, both by the upconing of (fossil) brackish groundwater as by intrusion of saltwater from the sea. An important difference with the Dutch situation is the local geology. The Netherlands is a young delta area, built alternately from sand and clay. The subsurface of Florida for a larger part consists of limestone, often with a complex groundwater flow.
The feasibility studies indicated the economic advantages of Freshkeeper with respect to other options, such as (full) conversion to brackish water RO that is becoming increasingly popular in Florida. The following step is the actual application of the Freshkeeper in a pilot test. For this ARCADIS and KWR have recently designed a project plan together with a west coastal water company.
In 2015 feasibility studies on the application of Freshkeeper as well as other innovative concepts for freshwater management in Mexico and Chili start, as part of the Securing Water for Food programme of the US Agency for International Development (USAID), the Swedish SIDA and the Dutch Ministry of Foreign Affairs. The European Commission (EC) recently approved SUBSOL, an R&D project that foresees replication pilots in the Netherlands, Denmark, Greece and the US.
The EC, USAID and its partners thus recognise the need to find sustainable solutions for freshwater supply in coastal areas as a counter-reaction to the worldwide increasing groundwater salinisation. In their view Freshkeeper and other Subsurface Water Technologies (SWT) are effective, cost efficient and robust fresh water solutions.

Klaasjan Raat
(KWR Watercycle Research Institute)
Ate Oosterhof
(Vitens)
Frans Heinis
(De Ruiter Grondwatertechniek)
Petra Ross
(ARCADIS)


Additional new concepts for freshwater management

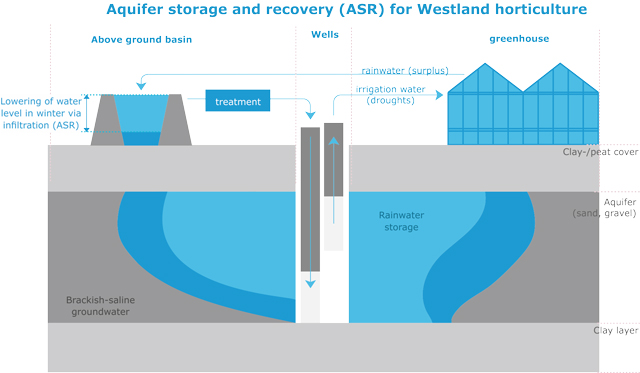
ASR-Coastal enables storage of fresh rainwater in brackish aquifers and unmixed return it for use as irrigation water.


The Freshkeeper was the first in a series of new concepts for improved freshwater management in coastal areas. Two other examples are ASR-Coastal and the Freshmaker.

ASR-Coastal makes it possible to store freshwater in a brackish subsurface and afterwards reclaim it unmixed. The concept is developed by KWR in cooperation with Dutch horticulture farmers and installers and was tested in a pilot on several locations in the Netherlands. Crucial is the way of recovering the freshwater from the brackish aquifer: only with multiple individually controllable filter screens it is possible to pump a large part of the infiltrated water unmixed for direct use on demand. But the application reaches beyond. At this moment it is considered to also apply other freshwater sources, such as treated effluent from the food industry or even treated sewage effluent.

The Freshmaker combines the concepts of the Freshkeeper and the ASR-Coastal. With use of the Freshmaker the naturally occurring, but thin freshwater lens under agricultural parcels in Zeeland in winter can be enlarged to better cover the freshwater demand in the summer. On a depth of 15 metres a horizontal well abstracts brackish groundwater, making room for the (artificial) infiltration of the fresh (rain) surplus. In summer this additionally stored freshwater is recovered and used for crop irrigation. The Freshmaker has since the summer of 2013 successfully been applied at horticultural farm Rijk-Boonman in Zeeland.

Summary

The principle of the Freshkeeper is that it not only abstracts fresh groundwater, but with the use of a separate filter screen, also the oncoming flow of brackish water. In that way the fresh-brackish interface is stabilised. With respect to the TKI-project Keep It Fresh! a test with a ‘smart well’ is carried out. The smart part being the control and measurement technology. In the end the well itself determines how much brackish groundwater is pumped and disposed, based on online measurements of the salinity of the groundwater. In ten years Freshkeeper developed from the drawing table to a concept tested in a practical pilot that is subject to international attention.


Literature


Grakist, G., C. Maas, W. Rosbergen en J. Kappelhof, 2002. Keeping our wells fresh. In: Proceedings of SWIM-17, TU Delft. R. Boekleman (ed.), p.337-340.

Oosterhof, A.T., M. van der Valk, J.A. de Ruijter en K.J. Raat, 2012. 'Freshkeeper' supplies separated brackish and fresh water from one well (in Dutch). H2O 2012(12): 14-15.

Ross, P.S., K.J. Raat, D.K. Smith, en W.J. Zaadnoordijk, 2014. Integrated Freshkeeper concept for sustainable water supply. Results Valorius programme, The Collaboration Climate and Weather. ARCADIS / KWR, report 077716526:A. Rotterdam / Nieuwegein, 229pp.

Van der Valk, M., 2011. A fresh-keeper for Noardburgum. The future for a salinated well field? Afstudeerscriptie opleiding Water Management, Technische Universiteit Delft.

Zuurbier, K.G., K.J. Raat, M. Paalman, A.T. Oosterhof, J.W. Kooiman, P.J. Stuyfzand, 2014. How subsurface water technologies provide robust, effective and cost-efficient freshwater solutions. Proceedings of IWA World Water Congress & Exhibition, Lisbon, September 21-26, 2014.

^ Back to start

FRESHKEEPER

For coastal areas around the world

ADVERTISEMENT

Royal HaskoningDHV

Knowledge section / Edition 1 / 2015

ABOUT WATER MATTERS

The knowledge section Water Matters of H2O is an initiative of


Royal Dutch Waternetwerk
Independent knowledge networking organisation for and by Dutch water professionals.


Water Matters is supported by

Alterra Wageningen University
Research institute that contributes by qualified and independent research to the realisation of a high quality and sustainable green living environment.


ARCADIS
Global natural and built asset design and consultancy firm working to deliver sustainable outcomes through the application of design, consultancy, engineering, project and management services.


Deltares
Independent institute for applied research in the field of water, subsurface and infrastructure. Throughout the world, we work on smart solutions, innovations and applications for people, environment and society.


KWR Watercycle Research Institute
Institute that assists society in optimally organising and using the water cycle by creating knowledge through research; building bridges between science, business and society; promoting societal innovation by applying knowledge.


Royal HaskoningDHV
Independent international engineering and project management consultancy that contributes to a sustainable environment in cooperation with clients and partners.


Foundation for Applied Water Research (STOWA)
Knowledge centre of the regional water managers (mostly the Water Boards) in the Netherlands. Its mission is to develop, collect, distribute and implement applied knowledge, which the water managers need in order to adequately carry out the tasks that their work supports.


Netherlands Water Partnership
United Dutch Water Expertise. A network of 200 Dutch Water Organisations (public and private). One stop shop for water solutions, from watertechnology to coastal engineering, from sensor technology to integrated water solutions for urban deltas.

ABOUT WATER MATTERS