Climate scan of large water bodies
What consequences does climate change have for large water bodies in the Netherlands and how can we make these water bodies more climate-resilient? This question is central to the 'climate scan' that Deltares recently published as part of the Programmatic Approach to Large Water Bodies (PAGW) of the Ministry of Infrastructure and the Environment and the Ministry of Agriculture, Nature and Food Quality.
The climate scan shows what is in store for us in terms of water quality and ecology and what we can do to achieve the PAGW ambition - the realisation of ‘future-proof large water bodies where high-quality nature goes hand in hand with a powerful economy’.
During the last few decades, the Netherlands has warmed up more than the world as a whole. Especially around 1990, the increase was intensified, both in the air and in the water (Figure 1). In addition to global warming caused by greenhouse gases, two other mechanisms are at work here. Firstly, since the end of the 1980s, the wind has come more often from the west, making winters relatively mild since then. Secondly, the decrease in air pollution in summers has played a role. Due to fewer particles in the atmosphere, the amount of fog decreased significantly. This increased the amount of sunlight and the daytime temperature. These two processes are gradually being overtaken by global warming.
Climate-related pressure factors
Increasing air temperature is only one of the climate-related factors exerting pressure on the large water bodies. The climate scan identified five more pressure factors: sea level rise, precipitation and river discharge, wind climate, fog and solar radiation, and water acidification.
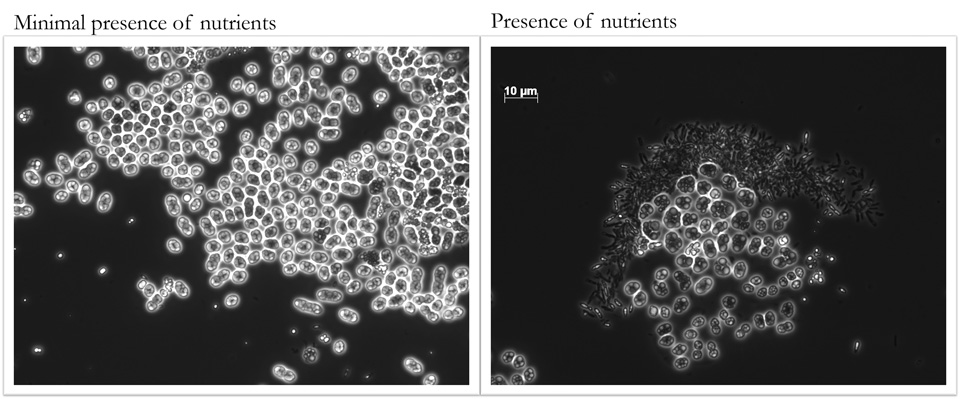
The effects of the various pressure factors on flora and fauna are largely due to the increase in water temperature. In warmer water, less oxygen dissolves and aquatic animals are more likely to die. The production of algae increases and starts earlier in the season. The increase in activity and growth of plants and animals does not occur to the same extent for all species. This can cause 'mismatches': food no longer being available at the right time. Northward shifts in the area where species occur can also occur in water bodies, just as on land. The chance of successful establishment of southern exotic species is also increasing at the expense of the existing species, so that diversity is decreasing. This also has implications for achieving the goals of the Water Framework Directive and Natura 2000.
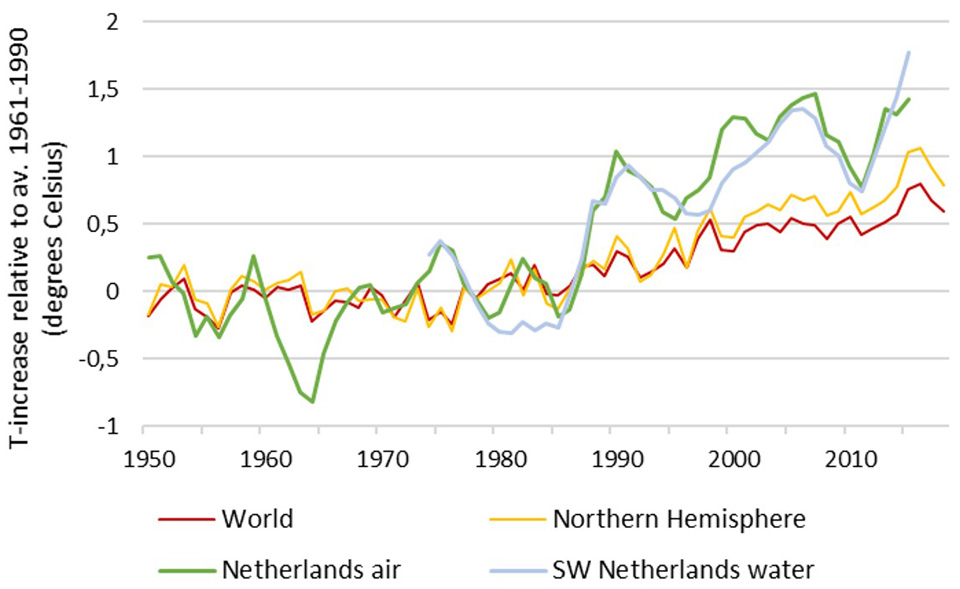 Figure 1. Increase in global average air temperature, northern hemisphere (Hadley Centre) and central part of The Netherlands (De Bilt, KNMI), and in water temperature in the South-western Delta (Department of Public Works; Grevelingen, Oosterschelde, Veerse Meer, Volkerak and Westerschelde)
Results per main water system
The Netherlands has four main water systems: the Lake IJsselmeer area (the large closed off inland bay (fresh water) in the central Netherlands), the River area, the Wadden Sea area and the Southwestern Delta. Each main water system has specific characteristics, which result in marked differences in sensitivity to the six climate-related pressure factors. The climate scan visualises this in text and infographics. Table 1 provides a summary.
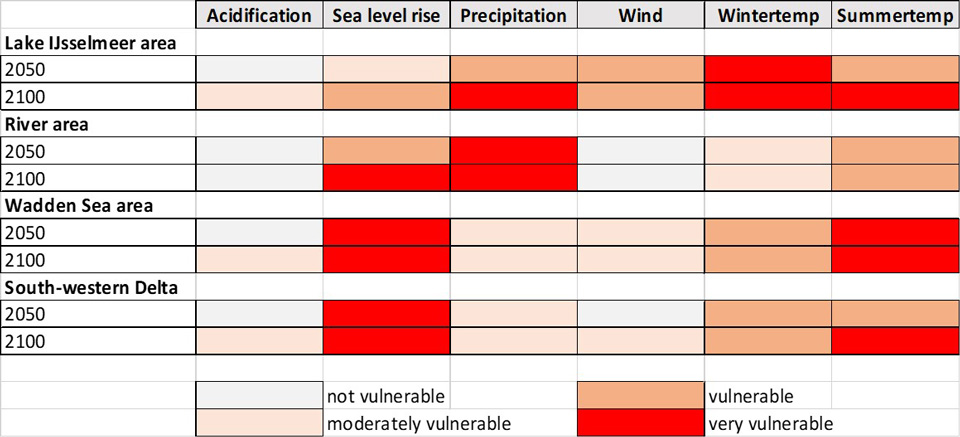 Table 1. Vulnerability of the four main water systems to the six medium- and long-term pressure factors of climate change
Lake IJsselmeer area
The lakes of the IJsselmeer area are characterised by a large surface area and shallow depth. They are therefore sensitive to changes in wind climate and warm up easily. On summer days with little wind, stratification of the water occurs, which can be accompanied by additional algal blooms and oxygen deficiencies. Due to the large surface area, changes in the amount of precipitation have a relatively large effect on the water and substance balance.
River area
The rivers are sensitive to changes in the discharge regime. These are caused by changes in precipitation patterns and an increase in evaporation in summer. Models predict increase of discharge in winter and decrease in late summer. The decline in late summer is gradually becoming measurable. In addition, extremely high or low discharge values and water levels occur more frequently.
The water temperature in the rivers has increased relatively strongly. At first, this was mainly due to cooling water discharges, later combined with climate change. Since 1900, the Rhine and the Meuse have warmed up by about 3°C on average. The increase is now levelling off due to regulation of cooling water discharges. The effects of changes in river discharge also interfere with a non-climatic pressure factor, namely the deeper incision of the main channel by the regulation of the rivers, which for example at Lobith has been 2 metres for the last 150 years and also affects the inundation frequency and duration of the flood plain.
Wadden area
With its large intertidal area, the Wadden Sea area is directly sensitive to sea level rise. The growth of mudflats in the western Wadden Sea is not expected to be sufficient in the future to keep up with the rise in sea level. The long-term fluctuations in wind patterns in the winter have temporarily amplified the rise in coastal water levels during the winter months. Due to the shallow water depth and the dryness, the intertidal areas are also extra sensitive to warming and to an increase in the frequency of mortality incidents of, for example, shellfish.
Delta area
The waters of the Southwestern (SW) Delta differ greatly from one another. The differences are mainly in salinity, freshwater-salt gradients, the presence or absence of tides and the degree of flow. Therefore, there is a varied combination of the factors mentioned for the other three main water systems. The most characteristic is a greater sensitivity to effects of sea level rise and changes in river discharge on the influence of salt water in the area. In addition, the open delta waters are sensitive to loss of intertidal area. The areas closed by the Delta Works are susceptible to intensifying problems of algal bloom, stratification and oxygen deficiency.
Working on resilience
The four pillars of resilience
An important part of the climate scan is the exploration of the possibilities to make the large water bodies more resilient to climate change. Shielding from the pressure factors of climate change itself by shading, compartmentalisation or deepening is hardly an option for the large water bodies. The motto is therefore to increase the capacity of the water systems to cope with changes, i.e. to make the water systems more robust and resilient. The possibilities for this are elaborated in the seven principles of resilience according to the Stockholm Resilience Center. For application in large water bodies, the climate scan distilled the four pillars of resilience from these: diversity, dynamics, connectivity (connection) and water quality. By working on these four basic factors, the resilience of the large water bodies can be increased. Within the framework of the PAGW, this is now done on a structural basis.
Customisation
The large water bodies in the Netherlands are all to a large extent 'artificial', influenced by human intervention, with the result that the four pillars of resilience are no longer in good order. The proportion in which they play a role differs per water system. Adjusting the pillars is customised and depends on the functions of the water system in question.
Problems such as algal blooms and oxygen deficiencies can often be remedied by increasing or restoring dynamics and connections (connectivity). This is done, for example, by flushing the Veluwerandmeren (Lake IJsselmeer area) or, more recently, by opening the sluice doors in the Haringvlietdam, by deploying the Katse Heule culvert for the Veerse Meer and by restoring dynamics to the Volkerak and Grevelingen (all in the the SW Delta).
Creating a greater diversity of habitats and species also contributes to resilience. If the food web is more complex, it is more resistant to external pressure. If several species perform the same function in the system ('redundancy') but respond differently to pressure, functionality is better preserved. Habitat diversity can be increased by restoring land-water transitions through the creation of under-represented habitats such as shallows and marsh areas. Examples are: nature development on Tiengemeten (SW Delta), Marker Wadden and Trintelzand in the Markermeer (Lake IJsselmeer area), more gradual freshwater-salt transitions such as with the fish migration barrier in the Afsluitdijk (between Lake IJsselmeer and the Wadden Sea) or the sluice doors in the Haringvlietdam (SW Delta), or digging side channels in the River area.
Good water quality, the fourth pillar, is a basic prerequisite. Eutrophication has been reduced by sharp declines in phosphate concentrations, but nitrogen concentrations are still well above the standards.
All in all, climate change is increasing the pressure on the larger water bodies. In combination with intensive use, the artificial layout and limited hydrological dynamics, it limits the ecological diversity and resilience of these systems. Therefore, under PAGW, more measures will be designed, often in spatial cohesion. In order to test the contribution of these designs to increasing climate resilience, the ‘Climate Compass’ was drawn up in addition to the climate scan. This allows zooming in on local effects and comparing design variants. Further knowledge development through literature study, analysis of data sets and modelling studies remains important to prepare the Netherlands for the consequences of ongoing climate change on aquatic ecology.
Ruurd Noordhuis
(Deltares)
Sacha de Rijk
(Deltares)
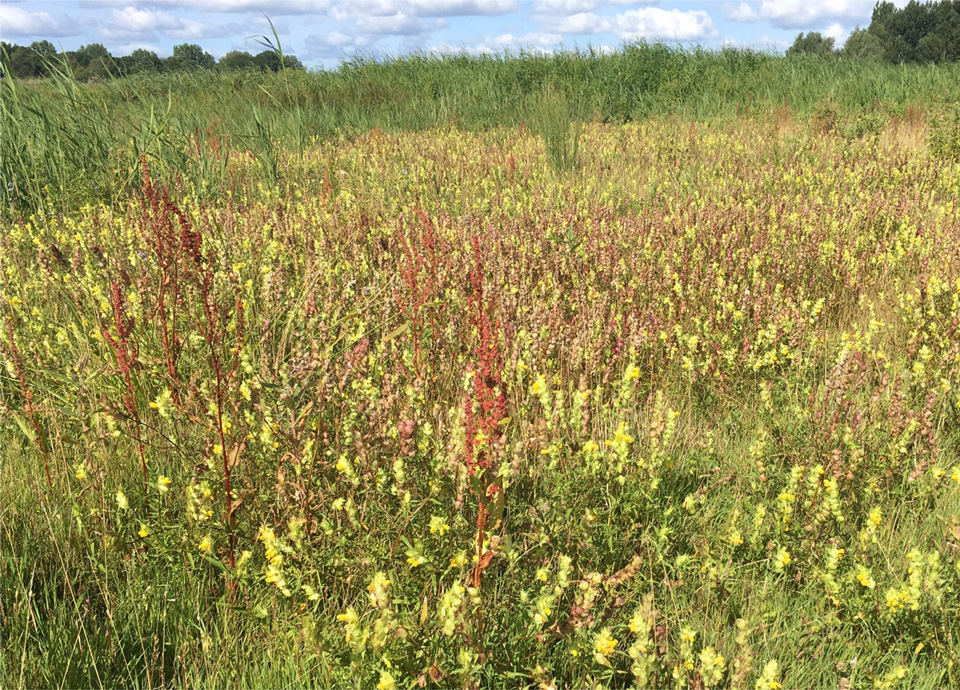
Background picture:
Photo: Moniek Löffler, Bureau Landwijzer
Summary
The climate scan explores the consequences of climate change for the four main water systems in the Netherlands.
The Lake IJsselmeer area is sensitive to changes in wind direction and wind strength, combined with warming and reduced ice cover. In the river area, the sensitivity lies mainly in changes in precipitation and evaporation, which influence the discharge. The Wadden Sea area is most directly affected by rising sea levels, which can lead to the loss of intertidal areas, especially in the west. In the South-western Delta, the effects of rising sea levels on draining possibilities, salt intrusion and freshwater-salt transitions are among the issues.
To make water systems more resilient to these changes, customisation is required, focusing on the four pillars of resilience: water quality, habitat diversity, (water level) dynamics and the connection between waters and habitats (connectivity).
Literature
Climate scan. R. Noordhuis, S. de Rijk, G. van Geest, M. Maarse, S. Vergouwen & A. Boon, Deltares, Utrecht, report 11203733-000-ZWS-0006, December 2019.
Use of Climate Compass for PAGW projects. Manual. S. de Rijk, V. Harezlak & R. Noordhuis. Deltares, Utrecht, report 11205270-003-ZWS-0001, December 2020.
Effects of temperature increase on large water bodies. A literature review with data overview. R. Noordhuis, L. van der Heijden & A. de Jong, Deltares, Utrecht, report 11205270-005-ZWS-0003, January 2021.
Climate variability effects on eutrophication of groundwater, lakes, rivers, and coastal waters in the Netherlands. J. Rozemeijer, R. Noordhuis, K. Ouwerkerk, M. Dionisio Pires, A. Blue, A. Hooijboer & G.J. van Oldenborgh. Science of the Total Environment 771 (2021) 145366.
Possible consequences of accelerated sea level rise for the Delta Programme. An exploration. Haasnoot, M., Bouwer, L., Diermanse, F., Kwadijk, J., Van der Spek, A., Oude Essink, G., Delsman, J., Weiler, O., Mens, M., Ter Maat, J, Huismans, Y., Sloff, K. & Mosselman, E. (2018). Deltares report 11202230-005-0002, Delft.
Climate adaptation in the river area. Klijn, F. A., Asselman, N.E.M., Hegnauwer, M., Mosselman, E. & Sperna Weiland, F. (2019). Landscape 2019 (2): 105-113.
^ Back to start