CONTENTS

Knowledge journal / Edition 2 / 2017

PREFACE

Water Matters: fresh insights based on thorough research

This is the sixth issue of Water Matters, the knowledge magazine from H2O professional journal. It contains nine articles about a variety of subjects, written by Dutch water professionals on the basis of thorough research.

The Editorial Board has made a selection from the proposals submitted, and thereby looked particularly for a clear link to everyday practice in the water sector. Another criterion was that the research, results and findings have to be new. Overall, that has resulted in articles that provide new insights with prospects for practical application.

This issue again covers a wide range of topics, from the spread of antibiotic-resistant bacteria in the surface water in residential districts through to a new method for determining fish populations using the DNA traces that fish leave in the water. Other topics include monitoring water temperature using fibre-optic cables and the role of crop rotation in reducing nitrate leaching.

Like the H2O professional journal, Water Matters is an initiative from the Royal Netherlands Water Network (Koninklijke Nederlands Waternetwerk - KNW), the independent knowledge network for and with Dutch water professionals. Members of KNW receive Water Matters twice a year as a supplement with their H2O professional journal.

The publication of Water Matters is made possible by leading players in the Dutch water sector. These Founding Partners are ARCADIS, Deltares, KWR Watercycle Research Institute, Royal HaskoningDHV, Stichting Toegepast Onderzoek Waterbeheer (STOWA) and Wageningen Environmental Research (Alterra). By publishing Water Matters the participating institutions want to make new, usable water knowledge accessible.

This English edition of Water Matters is partly made possible by Netherlands Water Partnership (NWP), the network of approximately 200 collaborating (public and private) organisations in the field of water. You can also read Water Matters digitally in Dutch at H2O-online (www.H2Owaternetwerk.nl), the Dutch edition is also available as a magazine.

The English articles can be shared from the digital magazine at H2O-online. Articles from previous issues can also be found on the website.

We hope you enjoy reading this issue. If you have any comments, please let us know at redactie@vakbladh2o.nl.

Monique Bekkenutte Publisher (Koninklijk Nederlands Waternetwerk)
Huib de Vriend Chairman Water Matters Editorial Board

PREFACE

Presenting: Water Matters!

Knowledge journal / Edition 2 / 2017

NL Fish Population Scan: characterising fish populations quickly and efficiently using eDNA metabarcoding

The NL Fish Population Scan has recently been developed. This method makes it possible to identify a complete fish population with a single analysis of DNA traces in the surface water. The first results from samples from the river Roer and a comparison with catch data from a fish trap are very promising.


eDNA: an alternative to traditional fish monitoring

Under the Water Framework Directive (WFD) water managers are obliged to periodically monitor the fish population. In addition, fish surveys are also carried out to meet Natura 2000 legislation. It is not easy to detect rare or hard-to-catch species using traditional survey methods such as electro-fishing and fishing with seines and trawl nets (types of dragnet). These techniques are also labour-intensive (and therefore expensive) and disrupt the fish and their habitat. Detecting fish on the basis of “DNA traces” (environmental DNA or eDNA) in the water (environment) is an alternative. This was investigated in a collaboration project involving KWR, the Brabantse Delta, Limburg and Aa en Maas district water boards, ATKB, Witteveen+Bos and Baseclear.

eDNA and metabarcoding

The eDNA methodology is based on identifying DNA traces left behind in the environment by living organisms. The eDNA in the water particularly comes from excrement, slime and skin or scales. These DNA traces spread in the water and are slowly broken down in around two weeks, depending on factors including the water temperature. DNA will not spread very much in still water, but in flowing water it will spread and therefore dilute further. A good sampling strategy is necessary in order to “catch” the eDNA of all fish species in a water sample. Such a strategy takes account of all ecologically varied habitats in a body of water or river section. Sampling must take place at the right depth, the right distance from the bank and at multiple locations in the water.

Table 1: Differences in DNA composition of the analysed “barcode” between the most closely related Dutch fish species.

The metabarcoding analysis developed in this study identifies the fish species present on the basis of their unique DNA code. A short DNA fragment of around 110 building blocks of the 16S rRNA gene was selected for this (region 42’ to 45’ of the 16S rRNA gene of fish (from Satoh et al. BMC Genomics (2016) 17:719)). This gene is present in the mitochondria of fish. The composition of this piece of DNA is unique for virtually every fresh water fish species in the Netherlands, and can therefore act as a unique “barcode”. Only with very closely related fish species are the differences small or absent, such as with Trout and Lavaret/Houting (table 1). Using specific DNA techniques, only these pieces of DNA in all samples are selectively multiplied and then analysed using next-generation sequencing analysis (NGS). The DNA sequence of all these fragments was compared with DNA “barcodes” for Dutch freshwater fish in collaboration with Baseclear. The study described here is the first result from an extensive study.

Figure 1: Percentage of the identified DNA fragments in the various metabarcoding analyses of the Mock samples (series H, A, B and C). These series differ in the number of DNA fragments added from each fish species. Series H is made up of DNA from 16 fish species. Series A, B and C included 100 (A), 10 (B) en 5 (C) DNA copies respectively from the fish species Perch, Roach, Carp, Monkey Goby, Three-spine Stickleback, Pike, Burbot and Wels Catfish. The number of DNA fragments for the other fish species in series A, B and C is the same as in series H. The “Calc.” column shows the percentage of the DNA of the fish species added in the Mock concerned, and in the two subsequent columns (1 and 2 respectively) the percentage identified barcodes in duplicate analysed with the metabarcoding.

Quality control of the metabarcoding

The quality of each run of the NL Fish Population Scan has been “verified” with a special water sample, a “Mock community”. This is an artificial sample containing the DNA of 16 different fish species. This sample is included in every analysis in order to verify the procedure from DNA multiplication through to identification. The sensitivity of the method has also been analysed. The DNA of some of the fish species in the Mock test has been added in very low concentrations. The results from the Mock samples show that all the selected fish species have been detected. The quantities of the identified DNA fragments correspond very well with the initial quantities (see figure 1). “Traces” of 5 to 10 DNA copies were also detected on all Mock samples. The metabarcoding analysis therefore passed this Mock test with flying colours.

Figure 2: Identified fish species at various locations along the Roer at Limburg district water board compared with the number of individuals caught by species in the period 2009 to 2014 at the ECI weir in Roermond
a. The ECI study makes no distinction between the two hard-to-differentiate Sculpins;
b. The various Trout belong to one species;
c. These species have not been analysed in the metabarcoding analysis.


Practical results

The NL Fish Population Scan was carried out at the three participating district water boards at various locations, particularly in flowing water. A procedure was drawn up for the sampling for slow-flowing and fast-flowing water courses. The initial results from samples from the Roer are now available. We will present the results from the other locations and the comparison with the survey using the traditional, standardised KRW method in a follow-up article (in a subsequent edition of Water Matters).
For Limburg District Water Board samples were taken on one day at seven locations in the Roer (see figure 2). A total of 33 different fish species were detected in the seven eDNA analyses. The identified fish species were then compared with the catch data from the fish trap at the ECI power station in the Roer at Roermond. A total of 45 fish species were found here over a period of 5 years. This one-day metabarcoding sampling detected only eight fish species fewer than in the five-year research period at the ECI fish trap (NB: sturgeon and lamprey have not been included in the eDNA analysis). The metabarcoding detected the Schneider in one water sample. That fish has not been caught at the ECI, but has been detected in KRW fish population sampling in the Roer. For fish species such as the Common Bleak, Perch, Roach, Bream, Eel, Ruffe, Dace and Round Goby the picture from the catches at the ECI (>1000 individuals) corresponds to the picture in the metabarcoding analysis. There was a significant difference between the catches of Salmon and the DNA analysis. This may be because of the migratory behaviour of this fish species, as a result of which it is only present during certain periods of the year. In order to gain better insight into the completeness and reliability of the metabarcoding analysis, the results will be extensively compared at a later stage with the fish species found using the KRW method.

Conclusions

• A good procedure for the sampling of watercourses for eDNA analysis is essential;
• The 16S barcode of the NL Fish Population Scan has a very high differentiating ability for virtually all freshwater fishes that occur in the Netherlands;
• The next-generation sequential analysis (NGS) has been validated: the methodology is reproducible and highly sensitive (≥5 DNA copies per sample);
• A Mock test is a valuable addition with which the reliability of the analyses can be established.
• Seven water samples were taken in the Roer in one day and analysed using the metabarcoding methodology. 33 of the 45 fish species caught in five years of research at the ECI weir were detected in the samples. One species, the Schneider, was detected with the metabarcoding analysis and not caught at the ECI weir;
• A comparison of the results of the metabarcoding analysis and the fish species present according to traditional KRW sampling still needs to be carried out. A report on this will follow later.
• The NL Fish Population Scan is an advanced methodology which enables to characterise the species composition of the fish population relatively quickly and cost-effectively. For routine application a standard would have to be drafted which specifies the criteria which a metabarcoding method must meet. A Mock test must be included in every analysis.

This project was a collaboration between the Limburg, Aa en Maas and Brabantse Delta district water boards, ATKB environmental consultancy, consulting engineers Witteveen+Bos, Genomic services Baseclear and KWR Watercycle Research Institute. Funding came partly from the Surcharge for Top Consortiums for Knowledge and Innovation (Toeslag voor Topconsortia voor Kennis en Innovatie - TKIs) from the Ministry of Economic Affairs (Water Top Sector). Naturalis and Sportvisserij Nederland contributed to the compilation of the fish barcode database.

Bart Wullings,
Dennis van der Pauw Kraan,
Edwin Kardinaal and
Michiel Hootsmans
(KWR Water)

Summary

Water managers must periodically assess the state of their fish population e.g. for the Water Framework Directive (WFD). Depending on the water type, they measure quantities or biomass data alongside the species composition. New methods that focus on the presence of eDNA (traces) are a cheap and animal-friendly alternative compared to traditional fish population sampling, and possibly also more reliable thanks to a higher chance of detection. A new eDNA metabarcoding has been developed to monitor the species composition of a fish population: the NL Fish Population Scan. The method has been validated, and a water sampling protocol has been drawn up. The initial results show that a wide diversity of fish species has been detected in the analysed waters using this metabarcoding methodology.

^ Back to start
eDNA

To determine fish population

Knowledge journal / Edition 2 / 2017

A step towards the environmental prioritisation of veterinary medicines from animal manure

Animal manure from intensive livestock farming is spread on arable fields and grassland on a large scale in the Netherlands. This manure can contain residues of veterinary medicines that have been given to livestock. Some of these substances are increasingly found in groundwater and surface water. Policymakers and soil and water managers would therefore like to have more insight into the likelihood that veterinary medicines will end up in the environment.

We have therefore carried out an exploratory study into two sectors in Dutch intensive livestock farming, pig farming and veal farming. In both sectors the manure from animals kept in stalls is collected in slurry pits and spread on arable fields and grassland from early spring onwards. The study focused only on the environmental behaviour of veterinary medicines, and not on any risks to human health and the ecosystem.
How many active substances from the administered veterinary medicines end up in the environment depends on – among other things - their use, the persistence during the manure storage and the behaviour in the soil (particularly persistence and mobility). Persistence is the degree to which a substance remains present without breaking down or disappearing otherwise. Mobility relates to the likelihood that substances leach out into groundwater and surface water.

Methodology

The study focused on the 20 most commonly used antibiotic and antiparasitic medicines in intensive pig and veal farming. We collected national consumption data for the years 2012 - 2014 for pigs and for 2015 for veal from the WUR Farm Accountancy Data Network (Bedrijveninformatienet) and reports from the Netherlands Veterinary Medicines Institute (Autoriteit Diergeneesmiddelen - SDa). We used the following usage classes to categorise the active substances from the products:
• more than 10,000 kilograms of active substance per year
• 5000-10,000 kg a.s./yr
• 1000-5000 kg a.s./yr
• Less than 1000 kg a.s./yr
The decomposition of a number of important antibiotics and antiparasitics in slurry was determined experimentally in test tubes in which the conditions in slurry pits were simulated (research by the RIKILT). We used the remaining percentage of active substance at the end of these experiments as an indication for the persistence in manure (Table 1).
Information about the rate of decomposition and mobility in the soil was found in the public literature. The rate of decomposition is specified by the half-life (DT50): the time required for 50 percent of the active substance in the soil to disappear. The sorption coefficient on soil organic carbon (Koc) was used for the mobility. This is calculated by determining in an equilibrium situation how much of the substance is bound to organic carbon in soil, and dividing this fraction by the fraction dissolved in pore water. The DT50 and the sorption coefficient were classified using an existing classification from the University of Hertfordshire (Great Britain), see Table 1.

Table 1: Criteria for characterising the environmental behaviour of veterinary medicines.
1) Fraction of the active substance still present in the manure after 24 days

Results

The information about the 20 active substances is summarised in Table 2. The first notable aspect is that the information is incomplete. One or more parameters are missing for approximately half of the 20 active substances.
Active substances which are somewhat stable in manure and in soil and which show high mobility have a greater probability of leaching into groundwater and surface water. This particularly applies to the sulfonamides (sulfamethoxazole and sulfadiazine) and trimethoprim. Based on persistence in the soil and high mobility, florfenicol could also end up in groundwater and surface water, but the persistence of this substance in manure is not known.
A recent overview of the occurrence of veterinary medicines in various types of water gives an indication as to how accurate our predictions are (table 2, click on the table for a better view). This shows that sulfamethoxazole, sulfadiazine and trimethoprim do indeed occur in the water chain, but for trimethoprim and sulfamethoxazole this is probably partly due to human use. In addition, and contrary to expectations, oxytetracycline and flumequine from animals were found in surface water in low concentrations, and amoxicillin has been found in drinking water made from groundwater. Out of the antiparasitics, levamisole has been found in waste water, but this is probably also related to human use.
There are also substances which are expected to occur in the soil and not in the groundwater of fertilised land. These substances are persistent and have little mobility in the soil. Examples are the antibiotics oxytetracycline, tilmicosin and flumequine and the antiparasitic ivermectin (Table 2). The fluoroquinolones enrofloxacin and marbofloxacin are immobile, but there is no information about their persistence in the soil.
The penicillins are very rarely encountered. They hydrolyse very rapidly in manure, and are also broken down well in the soil.

Table 2: Classification of us, persistence in manure, persistence in soil and mobility in soil for 20 veterinary medicines widely used in the Netherlands in intensive pig and veal farming. The intensity of the colours used indicate high values for the relevant characteristics. (click on the table for a better view)

1) see summary in the report by ter Laak e.a. (2017)
2) estimated from literature, no own measurement
3) these different substances are presented together here because only combined consumption data is available (the persistence in fertiliser is virtually identical for both substances)
4) use is considerable but not quantified


Meaning of the results

The approach in our study is relatively simple and semi-qualitative. The results may therefore give rise to comments. Firstly we have taken no account within the chain from animal to environment of the conversion in the animals’ body. However, we do know that metabolites play virtually no role for many antibiotics. Either they are hardly formed, or they are not active. Another point is that soils differ: leaching occurs more quickly in sandy soils than in clay, where surface run-off to ditches or drainage via drainpipes is more likely to occur. Veterinary medicine use in both sectors will also change over time.

The prioritisation outlined here is therefore indicative. Where sufficient substance data is available, the behaviour can be simulated with environmental fate models in order to predict concentrations of veterinary medicines in the soil, groundwater and surface water. However, our study shows that for many veterinary medicines there is no public data about their environmental behaviour. This crucial gap in knowledge is also highlighted in other publications. One important recommendation is therefore particularly to generate and/or publish more data about the environment characteristics of veterinary medicines.
Manure is increasingly being processed nowadays, as a result of which less slurry is ending up directly on the land. More pig manure than calf manure is currently being processed. However, a larger proportion of the calf manure produced is being processed (approximately a quarter) than the proportion of pig manure treated (approximately one tenth). The study did not examine manure processing and the use of the processed products. This will certainly have to be an area for attention in the future.

Finally we would like to stress that our study only examined the likelihood of encountering veterinary medicines in the environment. Evaluation of the potential effects on human health and the ecological risks will probably lead to an adjustment to the prioritisation. For example, ivermectin is known to be very toxic to water organisms. As a result, this substance could have effects in surface water despite the small chance of leaching. Ivermectin is therefore possibly still relevant for water management.
Despite the limitations, we believe that our overview is a useful first step towards prioritisation. Substances such as sulfamethoxazole, sulfadiazine, trimethoprim and possibly also florfenicol are relevant for protecting drinking water and surface water quality. These are therefore important substances for drinking water companies and district water boards to monitor and identify the risks. In addition, the antibiotics oxytetracycline (and probably also doxycycline), tilmicosin, flumequine, enrofloxacin and marbofloxacin and the antiparasitic ivermectin may end up in the soil via slurry. The most persistent substances in this group might even accumulate in the soil and reach terrestrial food chains (e.g. through soil fauna). We therefore recommend further investigation by the soil sector and the agricultural sector into the spread and risks of these substances as well.

Joost Lahr
(Wageningen Environmental Research, Wageningen University & Research (WUR))
Nico Bondt
(Wageningen Economic Research, WUR)
Tanja de Koeijer
(Wageningen Economic Research, WUR)
Louise Wipfler
(Wageningen Environmental Research, Wageningen University & Research (WUR))
Bjorn Berendsen
(RIKILT, WUR)
Paul Hoeksma
(Wageningen Livestock Research, WUR)
Leo van Overbeek
(Wageningen Plant Research, WUR)
Dik Mevius
(Wageningen Bioveterinary Research, WUR)

Summary

The use of slurry on arable fields and grassland can lead to the spread of veterinary medicines to soil, groundwater and surface water. We collected usage data and substance characteristics for the 20 most commonly used antibiotics and antiparasitics in two Dutch livestock sectors (intensive pig and veal farming) both through our own measurements and from the published literature. The likelihood of surviving the period of manure storage and then - after application on the land - the probability of leaching into groundwater and surface water and the persistence in the soil were assessed for the substances using this data.


Sources


Bedrijveninformatienet (Farm Accountancy Data Network - FADN) http://www.wur.nl/nl/Expertises-Dienstverlening/Onderzoeksinstituten/Economic-Research/Data-Insights/Bedrijveninformatienet.htm

SDa Netherlands Veterinary Medicines Institute. Various reports. http://www.autoriteitdiergeneesmiddelen.nl/nl/sda-rapportages

Ter Laak, T., R. Sjerps & S. Kools, 2017. Quick-scan diergeneesmiddelen in de waterketen (Quick scan of veterinary medicines in the water chain). Report 2017.037, KWR Water Cycle Research Institute, Nieuwengein, 47p.

University of Hertfordshire, 2017. The University of Hertfordshire Agricultural Substances Database Background and Support Information, version: September 2017, The University of Hertfordshire, Great Britain.

^ Back to start

VETERINARY MEDICINES

In slurry pit, soil and water

Knowledge journal / Edition 2 / 2017

Antibiotic-resistant bacteria in urban surface water and the role of misconnections

Antibiotic-resistant (ABR) bacteria are an increasing problem worldwide. Infections in humans with these bacteria are often difficult to treat. People can contract these bacteria in various ways, e.g. in hospitals, from livestock or by eating meat. However, ABR bacteria can also occur in surface water. This article describes the results of research into antibiotic-resistant bacteria in small-scale urban surface water and the possible role of misconnections to the sewer.

Water-related exposure

Previous research has shown that antibiotic-resistant intestinal bacteria occur widely in large surface waters in the Netherlands. Exposure can occur during leisure activities (swimming, canoeing etc.) or through the irrigation of crops (intended for human consumption). The ABR intestinal bacteria in the surface water originate from human and animal excrement. The waste water chain probably plays an important role in this. This can involve effluent from wastewater treatment plants (WWTP) and diluted wastewater that ends up in the surface water through combined sewer overflows (CSO) in the event of heavy rainfall. An estimate based on recent research shows that the wastewater treatment plants annually discharge the largest number of normal, non-resistant E.coli into the surface water (1017-1019 cfu, see table 1). However, the quantity of E.coli discharged by the CSOs is not much smaller (1017-1018 cfu – cfu stands for ‘colony-forming units’, a measure of numbers of bacteria). Approximately 1 percent of these E.coli populations involve the antibiotic resistant variant ESBL-EC (ESBL-producing E.coli). Both routes bring approximately the same number of bacteria into the surface water, whilst WWTPs discharge over fifty times as much water. The concentration of bacteria in water from combined sewer overflows is therefore much higher than in WWTP effluent.

Misconnections

A relatively unknown source of ABR in the surface water is misconnections in separate sewer systems. A switched house connection can result in wastewater from a home ending up in the stormwater sewer. The storm sewer then discharges this wastewater untreated into the surface water. An estimate suggests that approximately 2 percent of the connections to all stormwater sewers in the Netherlands are misconnected. That means that the wastewater of approximately 60,000 inhabitants is discharged untreated into surface water (2.7 million m3 per year). With a total E.coli content in raw and undiluted wastewater in the range of 108-109 cfu per litre, the estimated number of bacteria that reach the surface water in this way is comparable to that from WWTP effluent and combined sewer overflows, see table 1. Misconnections therefore appear - at least in theory - to be an important route for bacteria into Dutch surface waters.

Table 1: Volumes, concentrations and quantities of E.coli and ESBL-producing E.coli discharged annually in the Netherlands via three transmission routes from waste water to surface water (cfu= colony-forming units, i.e. quantities of bacteria)
** STOWA-RIONED, 2017
** Emissieregistratie, 2017

Study structure

This study examined whether misconnections can lead in practice to the presence of ABR bacteria in surface water. A total of five water systems in the Netherlands were examined. This article presents the results from two water systems: X and Y.

Figure 1: Sampling locations X1 to X 15 in system X (left) and Y1 to Y5 in system Y (right)

Samples were taken at 15 locations (X1 to X 15) in water system X, see figure 1 (left). The system is virtually isolated in hydrological terms, and is in a relatively large drainage area (over 2300 hectares) with many residential districts, some shopping districts and industrial sites. The sampling locations were selected randomly, but were evenly spread across the area. The area contains only separated sewers. The storm sewer outfalls discharge into the surface water.
Samples were taken at 5 locations (Y1 to Y5) in water system Y from a series of connected ponds in a residential district, see figure 1 (right). The district covers approximately 70 hectares and was originally equipped with an improved separated system that has, for the past few years, operated as a normal separated sewer system. The storm sewer outfalls discharge into the surface water. The samples were taken immediately adjacent to the outfalls. The ponds have no other upstream feed.

For both water systems, no WWTP effluent is discharged into them, nor water from combined sewer overflows. Nor is any water fed from upstream agricultural areas in either area. This excludes these three possible sources of ABR bacteria. In both areas all the locations were sampled twice: once in a dry period and once in a period with heavy rainfall. The samples were analysed for the intestinal bacteria Escherichia coli (E.coli) and Enterococcus spp. There was also an analysis for ABR variants: ESBL-producing Escherichia coli (ESBL-EC) and Ampicillin-resistant Enterococcus faecium (ARE). These two ABR variants regularly cause problems in hospitals.

Analysis results

Figure 2 shows the analysis results for system Y. E.coli and Enterococcus were found in all 10 samples from the surface water. Concentrations of total E.coli up to in excess of 104 cfu per litre were found in locations Y2, Y3 and Y4. These are fairly high concentrations which may only occur occasionally in ‘good quality’ water. There was no clear difference between dry and rainy weather: slightly more bacteria were found in dry weather. ESBL-EC were found in all 10 samples, and ARE in 5 of the 10 samples. The number of resistant bacteria per litre of water varies tremendously (from 1 to over 105 cfu). The results from the dry weather samples did not differ significantly from those for the wet weather samples for the ABR bacteria either. Samples taken at location Y4 consistently contained the highest quantities of (resistant) bacteria.
The results in system X did show a clear difference between dry and wet weather: for wet weather the concentrations of E.coli (103 -106) were considerably higher than for dry weather (102 -103). The same applied to the concentrations of Enterococcus spp. Many samples also contained resistant bacteria: 17 of the 30 (57%) samples contained ESBL-EC, and 11 of the 30 (37%) samples contained ARE. As with the ordinary E.coli and Enterococcus, the lion’s share of the resistant bacteria was found in the samples collected during wet weather. The concentrations of ABR bacteria were in the range of 1-1000 cfu/l.

Figure 2: Analysis results from locations Y1 to Y5 with E.coli and ESBL-producing E.coli in green, and Enterococcus spp. and ampicillin-resistant Enterococcus (ARE) in red. The lighter colours show the concentrations of resistant bacteria.

Discussion and conclusions

At the time of sampling, two types of antibiotic-resistant bacteria were widely present in the investigated urban surface water. These bacteria could not have come from WWTP effluent or from combined sewer overflows, nor from a feed of contaminated water from agricultural areas. It is possible that the ABR bacteria (partly) originated from domestic wastewater that was discharged untreated into the surface water via the stormwater system due to misconnections. The operator of the sewer system that discharges into system Y has “indications” that there are misconnections in the sewer system near the sampling locations (particularly location Y4). There are no such indications for system X. However, more bacteria were found in system X during rainfall than during dry weather. That suggests that here too the occurrence of resistant bacteria in the surface water is linked to the discharge from the storm sewers. For both systems (X and Y) animal excrement could also be a potential source of ABR bacteria. Examples are the run-off of dog faeces and (particularly in system Y) the presence of waterfowl.

Although misconnections at the locations X and Y are the most probable source of antibiotic-resistant bacteria in the surface water, that has not been incontestably shown in this study. The plan is to identify and resolve the possible misconnections in one or more areas (or implement an end-of-pipe measure) as a result of which the wastewater will no longer be discharged into the surface water. A follow-up study of the surface water could then give greater clarity about the source(s) of ABR bacteria.

Hetty Blaak
(RIVM)
Heike Schmitt
(RIVM)
Rémy Schilperoort
(Partners4UrbanWater)
Jeroen Langeveld
(Partners4UrbanWater)
Bert Palsma
(STOWA)

Summary

Antibiotic-resistant (ABR) bacteria can end up in small-scale urban surface water in different ways. Well known sources are wastewater treatment plants and combined sewer overflows. A relatively unknown source of ABR is misconnections in separate sewer systems. A switched house connection can result in untreated wastewater from a home ending up in the stormwater sewer and then into the surface water. An estimate suggests that approximately 2 percent of the connections to stormwater sewers in the Netherlands are misconnected. Research in two residential districts showed that antibiotic-resistant bacteria occurred in the surface water. Analysis shows that in both locations misconnections are the most probable source.


Sources (selection)


Blaak et al. (2015). Multi-drug resistant and extended spectrum β -lactamase-producing Escherichia coli in Dutch surface water and wastewater. PlosOne 10(6): e0127752.

Emission registration (2017). Www.emissieregistratie.nl, consulted November 2017

Schilperoort et al. (2011). Opsporen en classificeren van foutaansluitingen (Detecting and classifying misconnections). Vakblad Riolering, edition 18, December 2011, 14-15.

STOWA - Stichting RIONED (2017). ESBL-producerende Escherichia coli en ampicillineresistente Enterococcus faecium in oppervlaktewater. Een verkennend onderzoek naar bronnen van antibioticaresistentie in oppervlaktewater. (ESBL-producing Escherichia coli and amplicillin-resistant Enterococcus faeciumin surface water. An exploratory study into sources of antibiotic resistance and surface water.) In preparation.

^ Back to start

ANTIBIOTIC-RESISTANT

Bacteria in residential districts

Knowledge journal / Edition 2 / 2017

Passive sampling provides better insight into emissions of pharmaceuticals

The passive sampling method provides a better and time-integrated picture of emissions of pharmaceutical residues into waste water.

The presence of pharmaceutical residues in the environment is high on the political agenda. Parties from both the healthcare and water sectors under the leadership of the Ministry of Infrastructure and Water Management are therefore working together on the chain initiative ‘Pharmaceutical residues out of water’1.

This chain initiative is examining possible measures throughout the pharmaceuticals chain, such as measures in the development, approval, prescription and use of medicines or what the best locations are to modify sewage treatment plants (the ‘hotspot analysis’). Good insight into the emissions, fate and transport of pharmaceutical residues through the chain is essential in order to make an informed assessment of measures.
Conventional sampling with random samples provides a limited picture of the actual concentrations in the environment, particularly for substances with an irregular emission pattern. This can lead to the wrong conclusions being drawn, and ultimately to less effective steps being taken. One solution is to increase the monitoring frequency, but this often involves undesirable high costs.

In order to gain better insight into their emissions of pharmaceutical residues and the relative contribution to the total load on the sewage treatment plant, two academic hospitals in conjunction with Deltares have applied the passive sampling method. An absorbens is thereby placed in the relevant environmental compartment, in this case the waste water in various locations in the sewers. The substances present in the waste water are absorbed by the material, and after a specified period the passive sampler is removed from the waste water, extracted and analysed. This creates a time-integrated picture of the concentrations of substances in the waste water, and no substances are ‘missed’ any more. The detection limit is also reduced, because more than one litre of water is often sampled using the samplers. This sampled volume is particular dependent on the duration of the sampling, the flow speed in the sewer and the physical chemical properties of the substance.

About passive sampling
There are 2 different types of passive samplers: partition samplers and absorption samplers. With partition samplers, such as silicon rubber, the concentration of a substance on the sampler can reach equilibrium with the water phase provided that it is exposed long enough. This characteristic makes it possible to convert the concentration on the sampler to a time-integrated concentration in the water phase. This type of sampler is mainly suitable for hydrophobic substances. Since pharmaceuticals are generally fairly hydrophilic,the Speedisk® - an absorption sampler - was chosen for this study. The substances thereby bond to an absorption material and are hardly released again, which makes it harder to translate the concentrations on the sampler to the concentrations in the water phase. The calculated concentrations in this study are therefore indicative. More information about passive sampling and possible applications can be found in De Weert & Smedes (2014)2.

Material & Methods

In this study Speedisks were deployed in the sewer for a week and half at the effluent from the Radboudumc in Nijmegen and the University Medical Center (UMC) in Utrecht and at the influent and effluent of the sewage treatment plant in Nijmegen and Utrecht. The samplers were then extracted and analysed in the laboratories of TNO, Deltares’ partner in Utrecht Castel. In order to have an analysis package available which was as relevant as possible, the list of 'standard’ pharmaceuticals was supplemented with relevant substances derived from an analysis of the hospital pharmacy’s dispensing list. The final analysis package consisted of 80 pharmaceuticals, divided across the categories of antibiotics, contrast media, cytostatics, analgesics, beta-blockers, cholesterol inhibitors, antifungal products and other. This latter category includes the anti-epileptic drug carbamazepine, the diabetic drug metformin, but also ritalinic acid, the most important decomposition product of the psychostimulant ritalin.
Earlier projects have shown how much water the speedisk approximately samples per day on average. This quantity was used in order to convert the analysed concentrations on the samplers to indicative concentrations in the water phase. In order to determine the relevance of the hospital’s emissions with respect to the sewage treatment plant’s total load, the concentrations were converted to loads using flow data from the hospital and the sewage treatment plant. Removal yields for the pharmaceuticals found were calculated on the basis of concentrations in the sewage treatment plant’s influent and effluent. A combination of these two results provides a list of environmentally relevant pharmaceuticals for which the hospital is an important source.

Results

A comparison of the results from this study with results from grab samples from previous studies at the same sewage treatment plants shows that more pharmaceuticals were found on the passive samplers. Generally the estimated concentrations in the hospital’s effluent are many times higher for all substance groups than in the sewage treatment plant’s influent. An example for the group of antibiotics can be seen in figure 1.

Figure 1: Calculated concentrations of antibiotics in the water phase at various locations in the sewer.

The load calculations show that the hospitals are a relevant source AT the sewage treatment Plantfor a limited number of substances, caused by the relatively limited flow from the hospitals compared to the total flow to the sewage treatment plant, see figure 2 for the same group of antibiotics.

Figure 2: Calculated loads of antibiotics in various concentrations in the sewer.

The emissions of pharmaceutical residues at the sewage treatment plant mainly originate from sources other than hospitals, whereby households are the main source. This can particularly be seen for beta-blockers, cholesterol inhibitors, fungicides, a number of analgesics and antibiotics and carbamazepine. The substances with a substantial hospital share of the sewage treatment plant’s total load are the contrast media, the painkillers paracetamol and lidocaine, the plasticiser Bisphenol A and a number of antibiotics. The hospital’s share of the sewage treatment plant’s load in Nijmegen over the sample period was greater than in Utrecht, caused by the higher concentrations of pharmaceutical residues on the passive samplers. The flows for both the hospitals and the sewage treatment plants are comparable in both cities.
Notable for the radiocontrast agents and - to a lesser degree - for the antibiotics is thatit concerns different substances at both hospitals, and that for the radiocontrast agents these also differ from the substance that was found in another study3. Every hospital makes its own decision in the choice of products, which is an important aspect when compiling an analysis package.

As in previous studies, a large difference was found in the removal efficiency between pharmaceuticals, even when they are part of the same group. Hence the analgesic paracetamol is completely removed at the sewage treatment plant, whilst another analgesic, diclofenac, shows hardly no reduction in the sewage treatment plant. Combined with the hospital share, this results in a group of hospital-relevant substances which are not removed well, namely the contrast media, and to a lesser extent the analgesic lidocaine, the plasticiser bisphenol A and the antibiotic trimethoprim. For other sources - particularly households - it is especially the beta-blockers, cholesterol inhibitors, the painkiller diclofenac and carbamazepine that make an important contribution to emissions to the surface water. The group of antibiotics shows a somewhat variying picture. Both hospitals and other sources play a role with this group, and the picture for each product also differs between the two cities.
It was possible to carry out a certain degree of validation of the passive sampling results for both cities. In Nijmegen this was done by comparing the estimated concentrations with the hospital’s model-based emission estimates based on - amongst other things - the dispensing in the hospital4, and in Utrecht by comparing measurements against daily grab samples over the same time interval of the effluent at the sewage treatment plant carried out by RIVM.

Both comparisons show that the passive sampling results for most substances only differ by a factor of 2 at the most from both the emission estimates and the extensive measurements from the grab samples. In both cases the diabetic drug metformin was found to be an exception to the rule, which can be explained by the strongly hydrophilic nature of this substance. As a result, this substance probably does not bind to the passive sampler. The recovery experiments conducted in the laboratory also showed that certain cytostatics are found in insufficient quantities. These were therefore not included in the evaluation.
Like most studies into the presence of pharmaceutical residues in the environment, this study focused mainly on the presence of the pharmaceutical’s parent substance, whilst the drug will be converted to one or more metabolites in the human body or in the sewers. The analyses of ritalinic acid in this study show that the concentrations of metabolites of pharmaceuticals can be substantial, and that this can therefore change the overall picture of the emissions of pharmaceuticals.

Despite the fact that passive sampling displays a time-integrated picture of emissions of pharmaceutical residues, it remains a ‘snapshot’ of one and a half weeks in this case. To gain a more consistent picture of the emissions, it would be desirable to repeat this measurement. The translation from speedisk to water concentration remains an estimate, which was found to be fairly accurate for most substances. This means that passive sampling with speedisks is a particularly good screening method for estimating the emissions of pharmaceutical residues in various environmental compartments. Compared to monitoring with high-frequency random samples, this could result in a substantial cost saving.

Erwin Roex
(Deltares)
Andre Cinjee
(Deltares)
Henry Beeltje
(TNO)

1 http://jamdots.nl/view/239/Medicijnresten-uit-water
2 Jasperien de Weert, Foppe Smedes (2014) Overzicht toepassingsmogelijkheden van passive sampling (Overview of possible applications of passive sampling) STOWA report 2014.042. ISBN 978.90.5773.643.8.
3 Waterschap Groot Salland (2015) Grip op medicijnresten in ons water (Controlling pharmaceutical residues in our water)
4 C.J. van Loon (2016) Risk-based prioritization of pharmaceutical emission estimations based on pharmacy purchase data of the Radboudumc hospital. Reports Environmental Science no 545, master thesis.

Summary

Measurements for micropollutants are required in order to gain better insight into the emissions and distribution of the substances, but are relatively expensive and only show a limited part of the actual picture. This study shows that for pharmaceutical residues, passive sampling is a cost-effective method for obtaining a clearer picture of emissions.

^ Back to start
MEDICINE RESIDUES

How to measure emissions?

Knowledge journal / Edition 2 / 2017

The effect of the rotation of maize and grass on nitrate leaching


The nitrate concentration in the upper groundwater in sandy soils is considerably higher under maize than under grass. What role does crop rotation play in this, and how can one reduce nitrate leaching?

In the Evaluation of the Meststoffenwet (Fertilisers Act) the Netherlands Environmental Assessment Agency (PBL) states that the nitrate standard of 50 mg/l in the groundwater is achieved almost everywhere on average. Only in ‘Sand south’ (sandy soils in Noord Brabant and northern and central Limburg) is the average concentration higher than the nitrate standard. This can partly be explained by the soils in Sand south's greater vulnerability to nitrate leaching. Another cause for exceeding the nitrate standard in Sand south is the greater proportion of maize in this area. Maize is cultivated as a livestock food crop, often in rotation with grass.
Steps have already been taken in order to restrict the leaching under maize land. Hence farmers are required to grow a catch crop after the maize on sandy and loess soils. Farmers who use row fertilisation in maize cultivation can claim a relaxation of the nitrogen application standards. This article examines the effect of rotation on nitrate leaching and explores the possibilities for action in order to reduce the nitrate leaching under maize fields.

Available data

In order to determine the effect of crop rotation on the nitrate concentration, we have made use of data from the Minerals Policy Monitoring Programme (Landelijk Meetnet effecten Mestbeleid - LMM, www.rivm.nl/lmm). The LMM is a measuring network that has been used to monitor water quality and operations since 1992. The LMM measures the quality of the water that drains from the roots zone of the agricultural plots annually at 450 commercial farms.

For sandy soils the leaching is measured in the upper metre of groundwater or, if the groundwater is more than 5 metres below ground level, in the soil moisture in the layer between 1.5 and 3.0 metres. Shallow measurement means that the effects of agricultural practices become clear as quickly as possible.

Water is sampled at 16 randomly selected points at each farm. Two mixed samples are made from this, and the water quality of these is determined in the lab using a broad analysis package. The nitrate concentration of the 16 individual samples is measured in the field using a Nitrachek method protocolled by RIVM. The coordinates of the measuring points are linked to crop information derived from the Basic Register of Crop Plots (Basisregistratie Gewaspercelen - BRP). We have the crop history for the plot since 2009 available for each measuring point. This provides a maximum of 6 years of crop rotation prior to measurement, depending on the year of sampling. For this study we have selected nitrate measurements on sandy soils on which grass or maize was grown in the preceding year. This involves measurements between 2010 and 2015 (approximately 10,000 nitrate measurements).

Results

The measured nitrate concentration in the upper groundwater is linked to the crop in the preceding year, since the upper metre of groundwater is made up of the addition to the groundwater from the preceding year. At deeper groundwater levels the transit time through the unsaturated zone results in an even greater delay.

The nitrate concentration under plots where maize was cultivated in the preceding year is around twice as high as under grassland. This is partly the result of the higher denitrification in the turf; nitrate is thereby converted into nitrogen gas. In addition, maize land lies fallow in the autumn for some time (depending on the effectiveness of the catch crop) as a result of which the nitrogen remaining in the soil after harvesting can leach out more easily as nitrate.

The nitrate concentration does not just depend on the crop in the preceding year, but also on the cultivation history over the years prior to that. For first year grass after maize the average nitrate concentration is almost 60 mg/l (Figure 1). As the period when grass is grown after maize lengthens, the nitrate concentration declines. The turf develops over these years as a result of which denitrification increases and nitrogen is captured in the turf. There is also a ‘lag’ effect; it takes a couple of years before the high nitrate concentration from the maize production has been washed away.

The maximum number of years for which we have crop information is 6 years; for 6 year grass we therefore do not know what was cultivated previously, grass or maize. The nitrate concentration is higher for a period of grass cultivation of 6 years or more than for a shorter period of grass cultivation. We suspect that this is because old grass does not absorb additional nitrogen anymore; the capture of organic nitrogen by the crop is roughly equal to the decomposition. A longer period of grass cultivation also means that there is a higher probability of the grass being ploughed up sometime during the period. A lot of nitrogen is released when grassland is ploughed up, and this leads to a higher average nitrate concentration. Information about the ploughing up of grassland in a grass-grass rotation is not available for the measurement locations.

Figure 1: Nitrate concentration in the uppermost groundwater under grassland (after maize land) and maize land (after grassland) 1 year up to after six or more years after the crop switch. The line shows the 95 percent confidence interval for the average

For first year maize after grass, the nitrate concentration is around 100 mg/l. This nitrate concentration is high because the ploughed up turf releases a lot of nitrogen which is not all absorbed by the maize plants. As the period of maize after grass extends, the nitrate concentration appears to increase. In view of the small number of observations, the confidence intervals are large and this difference was not significant. However, we do see that the nitrate concentration for maize for 6 consecutive years or longer is significantly lower than for a shorter period of maize consecutively. We explain this decline by the fact that the effect of ploughing up grassland has then been exhausted.

Effects of the rotation of grass and maize

In order to study the effect of different rotations on the basis of the information specified above, we have created three imaginary farms on sandy soils with 20% maize land and 80% grassland and varying rotation. Farm 1 has no rotation, farm 2 has 40 percent of the fields in rotation between grass and maize (maize for two years, grass for two years). Farm 3 has 100 percent of the farm in rotation of 4 years grass and 1 year maize (see figure 2)

Figure 2: Three imaginary farms with 80% grassland. Farm 1 has no rotation, farm 2 has 40 percent rotation and farm 3 has 100 percent rotation of grass and maize.

Farm 1 only has permanent crops. With permanent maize (76 mg/l on average, >=6y in figure 1) and permanent grass (34 mg/l >=6y in figure 1) this farm has an average nitrate concentration of 42 mg/l.

Farm 2 has 60 percent permanent grass, with an average of 34 mg/l, 20 percent young grass (average of first and second-year grass, 47 mg/l) and 20 percent young maize (average 98 mg/l). On average across the entire farm the nitrate concentration is 49 mg/l.

Farm 3 consists of 4 equal parts of grass between 1 and 4 years old (57, 36, 33, 28 mg/l respectively) and one part first year maize (97 mg/l). For this fictitious farm the average nitrate concentration is 51 mg/l.

This shows that the rotation of grass and maize leads to higher leaching of nitrate than permanent cultivation. In order to grow maize, the grassland is ploughed up and a large amount of nitrogen is released. This nitrogen is not immediately absorbed fully by the maize, particularly if no account is taken of this in the fertilising, and leaches as nitrate. In the reverse situation where grass is sown after maize, it takes a couple of years before the nitrate concentration falls again and the turf has built up sufficiently to absorb or break down nitrates.

In the examples we have adopted 20 percent maize throughout. If the percentage of maize is higher, the average leaching at the farm will automatically become higher. This percentage has more of an impact on the average than whether or not grass and maize are rotated.

Based on this data the conclusion that restricting rotation can reduce nitrate leaching appears justified. However, restricting rotation conflicts with advice from agronomists and is not consistent with the results from research at experimental farms.

Cultivating maize for a longer consecutive period can have a unfavourable impact on the level of organic matter in the soil. The soil becomes depleted. In theory this could also lead to greater nitrate leaching. A healthy, fertile soil gives higher yields and therefore less leaching. Nitrates can also be decomposed better in a soil rich in organic material. Crop rotation is also a means of countering pests and diseases.

Research at the De Marke experimental farm shows that nitrate leaching is actually lower when grass and maize are rotated. In practice a benefit can still be achieved by applying the cultivation methods used in this kind of research more widely. The most important advice is not to fertilise first year maize on ploughed up grassland. Every kilogram of nitrogen which is applied then is entirely wasted and will leach to the upper groundwater. Other possible measures that reduce the leaching of nitrate in the event of rotation are:

- Early harvesting of maize, so that the grass still has the opportunity to grow well in the autumn.
- Undersowing grass as a crop after maize when the maize is still being cultivated.
- Adopting longer rotation periods, i.e. growing grass or maize from a number of consecutive years before rotating, and rotating in accordance with a fixed rotation schedule.

The wide application of these methods in practice will reduce the gap between practice and experimental farms and the benefit of crop rotation (higher organic material, limited disease) can be combined with reduced leaching of nitrates.

Arno Hooijboer
(RIVM)
Dico Fraters
(RIVM)
Koos Verloop
(WUR)

Summary

The nitrate concentration in the upper groundwater in sandy soils is considerably higher under maize than under grass. In practice the rotation of grass and maize results in more nitrate leaching than the permanent cultivation of these crops. This overlooks other positive effects of rotation, namely countering depletion of the soil and combating diseases. Research at experimental farms has shown that with adapted cultivation methods the nitrate leaching with crop rotation is lower than with permanent crops. The most important measure for this is not fertilising first year maize.

^ Back to start
NITRATE LEACHING

The effect of crop rotation

Knowledge journal / Edition 2 / 2017

Agriculture and WFD reduction targets for nutrients in regional waters

Reaching the ecological targets of the Water Framework Directive will require efforts by agriculture in order to reduce nitrogen and phosphorus loads on surface waters. The question is how much the loads by leaching and run-off from agricultural land need to be reduced, and what is the effectiveness of possible measures.

The European Water Framework Directive (WFP) is aimed at the sustainable protection of ecosystems and water supplies. Despite a slight improvement, the nutrient concentrations in 2027 will probably still be too high in approximately half of all regional waters3. A reduction of nitrogen and phosphorus loads by leaching and run-off is required in order to achieve the ecological targets. For a realistic assessment of the suitability of measures, insight is required into the sources of nitrogen and phosphorus in the surface water, and into the effectiveness and cost of the various measures.

Reduction targets for regional waterbodies

For regional waters the target for agriculture is defined as a reduction of the nitrogen and phosphorus loads on surface waters from agricultural land required in order to achieve a “good” ecological state in surface waters. This target is derived from the exceedance of the standards for the nitrogen and phosphorus concentration in regional bodies of water3. Using data from water and nutrient balances, these exceedances have been translated to the required reduction in the nitrogen and phosphorus load at the outflow and discharge points. Account is thereby taken of retention in the surface water. Retention6 is a collective term for various dissipation, capture and subsequent delivery processes of nitrogen and phosphorus. Examples are denitrification (nitrogen) and the binding of phosphate to soil particles.

Agriculture’s share in the reduction target: method

The source ‘agriculture’ contributes part of the nutrient load to surface waters. This contribution is calculated by calculating a nutrient balance sheet for each waterbody. Incoming items are: Leaching and run-off from agricultural land and and nature areas, supply from adjacent upstream catchments, supply from point sources and other diffuse sources4. The load passing the outflow point is the outgoing item. Nitrogen and phosphorus disappear by retention, hence the load at the outflow point is lower than the sum of the sources.
The contribution from agricultural land has been calculated using the STONE model1 which describes crop uptake, nutrient cycles in the soil and leaching processes. Using a sensitivity analysis, contributions from agricultural land are then unravelled into five sub-items: atmospheric deposition on agricultural land; fertiliser; soil processes; drainage of ditch water which is infiltrated during the summer and upward seepage (see figure 1, top left - see further the cited background report1). The soil is an important source in peatland areas due to the mineralisation of the peat; in recent reclaimed marine clay areas nutrients can be released from nutrient-rich sediment layers. The source ‘fertiliser’ is defined as the leaching and run-off caused by fertiliser applications, recently and in the past. Only part of the sources listed above can be influenced.

Figure 1. Attribution of the standards exceedances for N and P concentrations to sources. Clockwise from top left: the sources of nutrients in the surface water; retention means that only a part ends up in the surface water; part of this constitutes an exceedance; taking account of retention, a reduction in emissions of ‘more than the concentration exceedance’ is required.

The required reduction in the N and P load has been calculated based on the contribution from the various sources to the nutrient load and the required reduction at the outflow point. After offsetting the influence of retention, the requirement for all diffuse sources and point sources has been calculated.

Agriculture’s share in the reduction target: results

A substantial reduction in emissions will be required in order to meet the targets for nitrogen and phosphorus concentrations in regional surface waters. The sum of the required reductions at all outflow points amounts to 24 million kilograms of N and 2.3 million kilograms of P per year (figure 1, bottom right). Counting back to the load reductions at the sources and taking account of retention in the surface water, a reduction of 28 million kilograms of N and 3.1 million kilograms of P per year is required (figure 1, bottom left).
Which sources constitute ‘agriculture sources’ is a subject to debate. In practice the different points of view results in a range for the reduction to be achieved by agriculture for both nitrogen and phosphorus. For the Netherlands as a whole, the load on surface waters from agricultural land must be reduced by 5.7 - 8.1 million kilograms of nitrogen and 0.38 - 1.19 million kilograms of phosphorus annually2. This is equivalent to 10-20% of the total leaching of nitrogen and 10-40% for phosphorus. Figure 2, in which the upper limit of the ranges has been adopted5, shows that the differences between the areas are substantial.

Figure 2. Required reduction in the nitrogen and phosphorus leaching from agricultural land in order to meet the WFD targets.

Effects of measures

The STONE model has been used to explore the effects of a number of measures on nitrate concentrations in the groundwater (leaching) and the nitrogen and phosphorus load on surface waters2:


  • 1. Changing the cultivation plan for arable and horticulture crops in the southern sand region: replacing potatoes by a crop with a smaller nitrogen surplus, or: partly replacing a ‘late harvest’ crop by an ‘early harvest’ crop combined with growing a catch crop. This can reduce the nitrate concentration in the groundwater by 9-13 mg per litre and the nutrient load on surface waters by 5-10%. The effect on the leaching and run-off of phosphorus is limited.

  • 2. Improving the soil structure. This can be done with measures to restore the soil (breaking the ploughpan), preventative measures (incl. adapted agricultural machinery, increasing the organic matter content by providing compost) and by opting for deep-rooting agricultural crops. This can reduce the nitrate concentration in the groundwater by 7-10 mg per litre and the nutrient load on surface waters by 7-26%. The effect on the leaching and run-off of phosphorus is unclear because this is often determined - more than for nitrogen - by surface run-off and shallow transport routes. These transport routes, which in practice are partly determined by extreme weather conditions, soil characteristics and field relief, are hard to describe in calculation models.

  • 3. Improving nutrient utilisation, incl. through better placing and timing of fertiliser and maximum use of catch crops. On average this can result in a reduction in the nitrate concentrations in groundwater of 8-18 mg per litre for arable crops on sandy soil. The nutrient load on surface waters is reduced by 12-23%. The effect is smaller for clay soil, and the effect on phosphorous is unclear for all soil types.

  • 4. Modifying the water management of agricultural fields by:

    • a. Installing controllable tile drains in wet soils which have not previously been drained. This leads to an increase of the nitrogen load on surface waters by an average of 33% and a reduction of the phosphorus load of 25%.

    • b. Replacing existing tile drains (fixed level) with new drain tubes with a controllable level leads to a reduction of nitrogen leaching by 27-35%. Phosphorus leaching increases by 9-16%, but it can lead to reduction for some clay soils.

    • c. The use of submerged drain tubes in wet peatlands leads to 24% and 11% reductions of the load on surface waters by nitrogen and phosphorus respectively.

    • d. Installing ironsand-coated drainage pipes in sandy flower bulb fields in the western sandy region leads to a 60 to 90% reduction of the phosphorus leaching.

Conclusions

In order to meet the standards for nitrogen concentrations in regional surface waters by 2027, the load from agricultural land needs to be reduced by more than 40% and sometimes more than 70% in parts of the Southern and Eastern sandy region. The measures considered can result in a reduction of the nitrate leaching to the groundwater ranging from 5-10% to 15-25% in the sandy regions. It appears that it will be possible to meet the reduction targets for a large number of waterbodies by using a combination of the measures, but for the clay and peat areas the measures will only partly contribute to achieving the reduction target.

In order to meet the standards for phosphorus concentrations, the load on surface waters from agricultural land must be reduced by 40 to 70% in the Western Netherlands, the Southern sandy region and Twente, an in some areas by more than 70%. This reduction target cannot be met with the measures examined or a combination thereof. Because a large proportion of the leaching and run-off is determined by phosphate stocks already present in the soil, it can only be minimally influenced. Alongside the measures considered here, measures are needed which tackle transport routes and/or measures with a purifying effect on the surface water.

Piet Groenendijk
Wageningen Environmental Research (Alterra)
Erwin van Boekel
Wageningen Environmental Research (Alterra)

Summary

In a large number of the regional waterbodies the nitrogen and/or phosphorus concentrations do not yet meet the standards for a good ecological state. The exceedance is partly caused by nutrient leaching from agricultural land. By quantifying various sources a calculation has been made for each waterbody of the required reduction of the nutrient leaching from agricultural land. The national average for this is 10-20% for nitrogen and 10-40% for phosphorus.

Models were used to explore the effects of four measures (modifying cultivation plan in the southern sandy region, soil improvement, improving nutrient utilisation and drainage) on the nitrogen and phosphorus loads on surface waters. It appears that the reduction target can be met for nitrogen for a large proportion of the regional waterbodies in the sandy regions with a combination of measures. The measures only have a limited effect on the leaching and run-off of phosphorus. Other and/or supplementary measures are required to achieve targets for phosphorus.


Sources


1. Groenendijk et al (2014) Bronnen van diffuse nutriëntenbelasting van het oppervlaktewater (Sources of diffuse nutrient load in the surface water); Evaluatie Meststoffenwet 2012 (Fertiliser Act 2012 evaluation): ex post partial report. Wageningen, Alterra. Report 2328.

2. Groenendijk et al (2016) Landbouw en de KRW-opgave voor nutriënten in regionale wateren (Agriculture and the WFD requirement for nutrients in regional waters). Het aandeel van landbouw in de KRW-opgave, de kosten van enkele maatregelen en de effecten ervan op de uit- en afspoeling uit landbouwgronden. (The share of agriculture in the WFD requirement, the costs of several measures and their effects on the leaching and run-off from agricultural land) Wageningen, Alterra. Teport 2749.

3. PBL (2015) Waterkwaliteit nu en in de toekomst (Water quality now and in the future). Final report on ex-ante evaluation of the Dutch plans for the Water Framework Directive. The Hague: PBL. PBL publication 1727

4. www.emissieregistratie.nl version 2013

5. PBL (2017) Evaluatie Meststoffenwet 2016 (Fertiliser Act 2016 evaluation): Synthesis report. The Hague: PBL.

6. Van Gerven et al (2009) Retentieschatting van N en P in het oppervlaktewater op verschillende schaalniveaus (Retention estimate of N and P in the surface water at various scale levels). Wageningen, Alterra. Report 1848.

^ Back to start

WFD TARGETS

Does clean agriculture help?

Knowledge journal / Edition 2 / 2017

New DNA tool for detecting Weil’s disease bacteria and their source in surface water

Newly developed (e)DNA methods make it possible to show the presence of pathogenic Leptospira and brown rats in surface water samples. By including multiple samples for each location, the source can be accurately identified.

The number of cases of leptospirosis in the Netherlands has increased since 2014 to 0.57 per 100,000 inhabitants, a tripling compared to the period 2010-2013. This worrying trend has also been observed in neighbouring countries and has remained undiminishedly high in recent years (2014-2016).

Leptospirosis is one of the most common diseases that can be transmitted from animals to humans - a zoonosis - worldwide. The disease is caused by corkscrew-shaped bacteria of the genus Leptospira. Transmission to humans generally occurs through direct or indirect exposure (e.g. via contaminated water) to urine from infected animals, and results in more than one million serious cases of illness worldwide every year. Infection can lead to a wide range of symptoms in humans ranging from flu-like symptoms to the development of Weil's disease, which can be accompanied by complaints including jaundice and serious kidney and lung problems with a potentially fatal outcome.
Around 60 percent of the infections in the Netherlands can be linked to contact with water. This is therefore the most important pathway of infection. The peak of infections is in the summer months. The main reasons for this are increased exposure through more recreational activities (like swimming or mud-runs), more chance of survival for Leptospira in warmer water, and increased activity by the animals that spread these pathogenic bacteria.

Initial screening

A DNA method has recently been developed in order to identify pathogenic Leptospira bacteria in surface water (H2O online, 21 Aug 2017). An initial screening of samples obtained from swimming water locations showed on average 16 percent of the samples contained DNA material from pathogenic Leptospira. This percentage varied considerably by location, with a number of peaks up to 40 percent. However, the source of these positive observations is not known. Rodents and, more specifically, the brown rat (Rattus norvegicus) are generally considered the most important carrier of Leptospira. The Leptospira spread by brown rats are serovars which can cause serious disease in humans. In the Netherlands an estimated 30 percent of brown rats are infected with pathogenic Leptospira spp. Catching and monitoring rats is specialised and laborious work which require special training and also involves considerable costs.
In order to both identify the presence of pathogenic Leptospira in water and get insight in possible sources, a method has recently been developed for detecting the DNA that brown rats leave behind in the environment (environmental DNA = eDNA). By detecting brown rats’ eDNA, it is possible to identify and monitor the presence of this rat in surface water on a large scale and in a non-invasive manner.

This study had three goals: i) to develop an eDNA method for detecting brown rats in surface water, ii) screening surface water samples in order to identify pathogenic Leptospira and the probable source- brown rats - over time, and iii) to gain insight into the spatial distribution of Leptospira and brown rats on a local scale.
By using these DNA methods, (location) managers can estimate the risk of infection with pathogenic Leptospira and assess whether measures against potential sources (e.g. brown rats) can contribute to better protection of swimmers and other recreational users.

MATERIAL AND METHOD

Development of eDNA method for brown rats

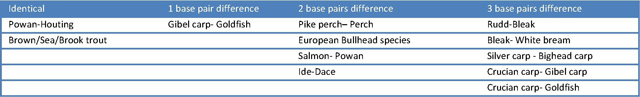
A previously developed set of DNA primers (H2O online, 21 Aug 2017) was used to screen surface water for the presence of Leptospira. A set of DNA primers with probes were developed to screen for the presence of brown rats. This set has been designed to specifically detect the cytochrome-B gene of the brown rat. The selectivity of the primer set has been verified by testing DNA from various animal species (table 1), including close and more distant relatives of the brown rat.

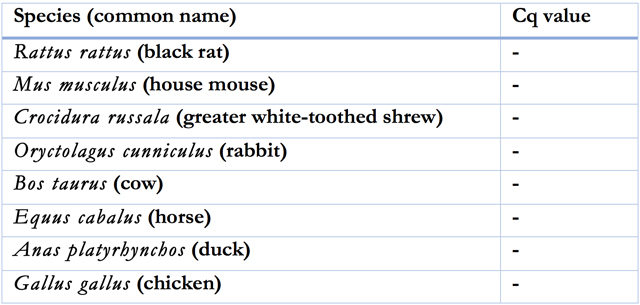
Table 1: List of species for which it has been shown that the primer set cannot detect species other than the brown rat (indicated by the absence [-] of a test value [Cq])

Experimental format of screening

Using the eDNA method described above, surface water samples were screened for the presence of brown rats and pathogenic Leptospira. These water samples were part of the monitoring by Rijkswaterstaat for faecal contamination and harmful algae at official bathing water locations. Sampling took place fortnightly or monthly, depending on the location, between May and the end of September. This period therefore covers the swimming season and the associated peak in leptospirosis cases. A total of 86 samples from 13 locations were analysed for the screening.

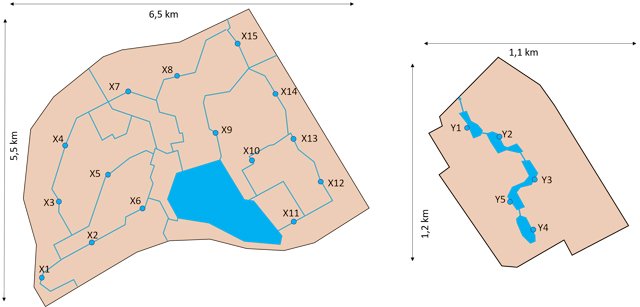
Two locations were studied in more detail. Multiple samples were taken in order to determine the link between Leptospira and brown rats on a local (spatial) scale. In addition, this can be used to examine the effect of sampling strategies on the chance of detecting both species. Ten samples were taken at location 1 (figure 1-A). High values for Leptospira were previously detected at this location. 16 samples were taken at location 14 (figure 1-B, not included in the screening described above). In this location, following an outbreak of leptospirosis in 2015, management steps were implemented to reduce the rat population.
100-250 ml of water was filtered from all samples. Subsequently DNA was isolated in accordance with KWR procedures.

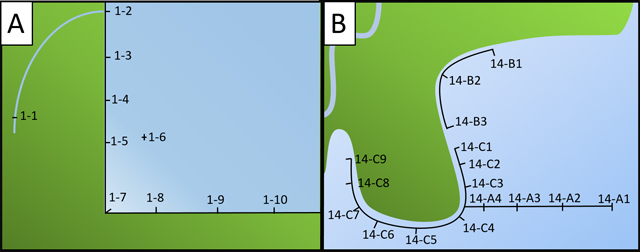
Figure 1: Graphic presentation of location 1 (A) and 14 (B) with the sampling points.

RESULTS

Detection of brown rat eDNA

The eDNA tool developed here makes it possible to detect brown rats in surface water. 15.1 percent of the screened samples contained brown rat eDNA. The highest positivity rate (30%) was found in samples from locations 12 and 13 (figure 2). Throughout the study period no brown rat eDNA was detected at locations 2, 4, 6, 9 and 11.

Detection of pathogenic Leptospira

DNA from pathogenic Leptospira was detected in 34.9 percent of the screen samples. At locations 1 and 13, 55.6 en 60.0 percent respectively of the samples were positive for pathogenic Leptospira. Of the 13 studied locations, no Leptospira were detected at three locations throughout the period: these were locations 3, 6 and 7 (figure 2).

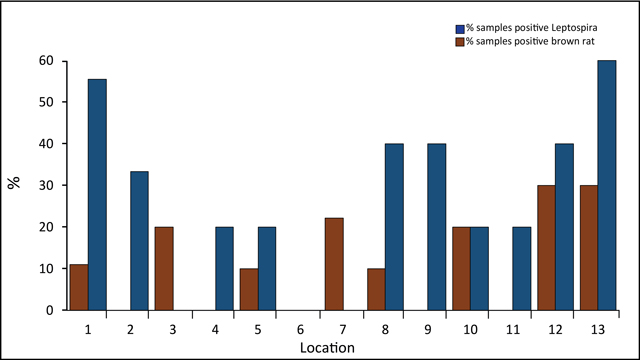
Figure 2: Percentage of positive samples for brown rats (brown bars) and pathogenic Leptospira (blue bars) by location.

Joint occurrence of Leptospira and brown rat eDNA

DNA of both pathogenic Leptospira and brown rats were found at six locations: locations 1, 5, 8, 10, 12 and 13. More than half of the samples positive for brown rats were also positive for Leptospira. This represented 8.15 percent of all examined samples.

Local distribution of Leptospira and brown rat eDNA

Two locations were intensively sampled: 1 and 14. Ten water samples were taken at location 1 (figure 1-A), of which three tested positive for Leptospira (namely 1-2, 1-6 and 1-10) and two for brown rats (namely 1-1 and 1-8). However, no sample was positive for both. The sampling points were fewer than 50 metres apart. At location 14 (figure 1-B) none of the samples were positive for brown rats, whilst four samples were positive for Leptospira: 14-C1, 14-C3, 14-C8 and 14-C9.

Discussion and conclusion

The DNA methods described were used to screen for the presence of Leptospira and brown rats in water samples obtained from bathing water locations for which Rijkswaterstaat is the water quality manager. Both Leptospira and brown rats were detected in a substantial number of samples. This suggests that brown rats are the probable source of Leptospira at these locations.

Notably are the cases where Leptospira was found and no brown rats, or vice versa. The former could be explained by the fact that the rat population in those locations is not infected with Leptospira - it is estimated that approximately 30 percent of Dutch rats are infected. The latter could be caused by the fact that there is a source of the Leptospira other than brown rats, such as other rodents or cattle. Further research in order to identify sources other than brown rats could give an answer to this. Use could be made of existing DNA markers for various animal groups as used to trace the source of faecal pollution (see also Heijnen et al, 2014, H2O-online). More accurate determination of the specific species of Leptospira could also identify alternative sources.
The filtered volumes of water were small (100-250 ml) in this study. Sampling larger volumes or combining multiple small volumes from a location would considerably increase the detection rate An example of this is the dense sampling strategy applied at locations 1 and 14. The additional benefit of more intensive sampling of a location is that in some cases the source can be detected fairly accurately, after which targeted control measures can be applied.

Elmar Becker
(KWR Watercycle Research Institute/University of Amsterdam)
Ahmed Ahmed
(OIE and National Collaborating Centre for Reference and Research on Leptospirosis, AMC, Amsterdam)
Marga Goris
(OIE and National Collaborating Centre for Reference and Research on Leptospirosis, AMC, Amsterdam)
Hans Ruiter
(Rijkswaterstaat-WVL)
Bart Wullings
(KWR Watercycle Research Institute)
Edwin Kardinaal
(KWR Watercycle Research Institute)

Summary

The newly developed (e)DNA detection methods make it possible to show the presence of pathogenic Leptospira and brown rats in surface water samples. However, this study shows that traces of brown rats and Leptospira can be observed both together and separately. By combining multiple samples per location, a detailed picture of the source can be obtained, for which specific control measures can be defined in a well-substantiated and targeted way.

^ Back to start
LEPTOSPIROSIS

Source accurately identified

Knowledge journal / Edition 2 / 2017

The effect of cation addition and aeration on sludge dewatering


The dewatering of sewage sludge is an important cost item for the district water boards. The purchase of flocculants for dewatering on itself costs about 23 million euro a year. The literature shows that addition of multivalent cations (iron, magnesium, calcium) and aeration can improve the dewaterability of sewage sludge. An assessment of whether this also works in practice was carried out at three sewage treatment plants and in the lab.


The combination of aeration and cation addition (magnesium) is used in - for example - the Airprex process. Struvite is thereby recovered, and the dewaterability is improved. A study funded by Stowa (Stowa 2016-11) was intended to give greater insight into the role of cations and the effect of aeration on the dewaterability.

Testing in practice and in the lab

Literature research shows that it is particularly the bivalent cations such as magnesium and calcium that improve dewaterability by their effect on the electrical charge of the sludge flocs: they are particularly bonded to the polysaccharides in the sludge. Trivalent cations such as iron (Fe3+) behave differently, probably because they particularly bind to colloidal proteins and thereby improve the dewatering. This study examined the effect of calcium (Ca2+), magnesium (Mg2+), and trivalent iron (Fe3+).
The study involved practical tests at sewage treatment plants Nieuwgraaf, Beverwijk en Amsterdam West. The aim was to demonstrate the effects of cation addition and aeration on the dewaterability of sludge. In addition, laboratory tests were carried out on the addition of cations to sludge.

Practical tests

The effect of cation addition on the dewaterability was tested at three sewage treatment plants.


In the practical test at sewage treatment plant Nieuwgraaf, trivalent iron (Fe3+) was added to the sludge. The two lines on the graph below show the relation for two different Fe dosages between the dosage of polyelectrolyte (PE) and the dewatering result (DM% of the sludge). The results to the left of a line result in a saving compared with the existing situation. To the right of a line the costs of cation addition are higher than the savings. The letters refer to the period specified in the table.


At sewage treatment plant Nieuwgraaf the addition of Fe3+ enabled a reduction in PE consumption by more than 50%. The dry matter content of the sludge cake could also be increased from 25% to 29% because the addition of iron allowed the torque on the centrifuge to be increased. A reduction in PE consumption and the higher dry matter content result in a net saving of up to 180,000 to 210,000 euro per year, or around 15% of the costs of sludge disposal and PE consumption. These figures include the formation of chemical sludge (deposit of iron salts in the sludge) and the costs of iron itself.

At sewage treatment plant Beverwijk the addition of magnesium was found to reduce PE consumption by 40%. The dry matter content of the sludge cake increased by approximately 1% net. Comparable addition of calcium gave the same improvement in the dry matter content of the sludge cake, but the reduction in the PE consumption was less at 18%.

The effect of the Airprex system was tested in the practical trial at sewage treatment plant Amsterdam West. Magnesium and aeration were already used there as part of the struvite production. The trial involved using respectively low and high aeration; the Airprex system was not used in period C (bypass).


Low aeration combined with the current dose of magnesium gave a better dewaterability of the digested sludge. The PE consumption was approximately 28% lower. At higher aeration the PE consumption was 15% lower, and the sludge cake had a slightly higher dry solids content (0.5 - 1.0 DM%). It was not possible to fully stop the aeration, because the aeration is necessary for - amongst other things - mixing and managing the pH in the Airprex reactor.

The situation with low aeration is financially the most favourable. One positive effect of the high aeration is that struvite production increases because of a higher pH in the struvite reactor. At the same time, however, the aeration also causes disintegration of the sludge flocs, which reduces the positive effect of magnesium addition.

The effect of cation addition on extracellular polymer structures (EPS), was also examined at the three sewage treatment plants. EPS are long organic molecules in the sludge which can be bound to the sludge flocs “firmly” or “loosely”. “Loosely bound” EPS gives poor dewaterability because there are more charged and colloidal particles that need to be bound by PE. The results show for the three sewage treatment plants examined that when cations (Fe, Mg or Ca) are added, the level of “loosely bound” EPS decreases. More information about this can be found in the STOWA report.

Lab tests

The laboratory tests were conducted at Royal HaskoningDHV’s Technical Research Centre (TRC). The aim was to assess whether lab tests can be used to assess the effect of cations on the dewaterability of digested sludge. The dewaterability was determined using the following methods:

  • Capillary Suction Time (CST): the time (in seconds) that it takes the water from the sludge to flow a fixed distance over a standard piece of filter paper. The higher the CST, the poorer the sludge’s dewaterability;

  • Filtration with a Mareco filter press: After polyelectrolyte (PE) is added, sludge is compressed between two filter cloths, after which the dry matter content of the sludge cake is determined. The higher the dry matter content, the better the dewaterability;

  • Streaming current test (SC): After measuring the charge of the sludge, a PE solution is added until the isoelectric point (0 mV, neutral charge) is reached. The quantity of PE solution is a measure of the PE consumption in practice.

The CST test is a widely used test for measuring the dewaterability of sludge, but only determines the free water part. Pressure tests with the Mareco are being used more often as an indication of the dewaterability and were performed here in accordance with a protocol developed by Royal HaskoningDHV. The protocol for the SC test has been developed by Royal HaskoningDHV and Aiforo.

All three tests showed that the addition of cations has a positive effect on the dewaterability. For all three sewage treatment plants the laboratory tests were found to give a good indication of changes in dewaterability in practice. The most consistent results were obtained with the CST test and streaming current test (SC). The pressure tests are the only test that can provide information about changes in the dryness of the sludge cake, but showed a wide spread in test results.

Conclusions

This study shows that addition of salts with multivalent cations (iron, magnesium, calcium) can improve the dewaterability of sludge, and that in many case the costs of the salt addition would be earned back through reduced PE consumption and sometimes also an increase in dry solids content of the sludge cake. The addition of iron salts showed the greatest improvement on both laboratory and practical scale.
The results with magnesium provide insight into the mechanism behind the positive effects on the dewaterability of sludge which is often encountered when recovering struvite. The positive effects are probably particularly caused by the necessary overdosing with magnesium, by which, as a result, the structure of the sludge flocs is improved. The study also shows that the aeration of sludge, which is needed in order to obtain struvite in the Airprex process amongst other things, actually has a negative effect on the dewaterability. Maximum recovery of struvite requires sufficient aeration to increase the pH of the sludge, but therefore does not give a maximum improvement in the dewaterability.

The lab tests used were found to give a reasonably good prediction of the effects on the dewaterability. However, practical tests remain necessary in order to be able to properly determine the quantitative effects. It was also found that the effects were not the same for all examined sludges. The conclusion is that every sludge dewatering requires its own investigation in order to determine the optimum treatment.
Further research is needed in order to further unravel the mechanisms of sludge dewatering. A first encouraging step has been taken in this study by measuring effects on the extracellular polymer structure (EPS) in the sludge. Difference in the EPS content correlated well with the differences found in the dewaterability.

David Berkhof
(Royal HaskoningDHV)
Leon Korving
(Aiforo)

Summary

This study examined the effect of cation addition and aeration on the dewaterability of digested sewage sludge. Lab tests were combined with practical tests at sewage treatment plants Nieuwgraaf, Beverwijk and Amsterdam West. Effects were found to differ from location to location. At sewage treatment plant Nieuwgraaf the addition of iron salts could lead to a saving of approximately € 200,000 a year. At sewage treatment plant Amsterdam West it was found that the required aeration of sludge to increase struvite production can limit the positive effects of magnesium on the dewaterability. At sewage treatment plant Beverwijk location there was found to be an optimum point for the PE dosage. Beyond this optimum, cation addition actually led to higher sludge processing costs. It is therefore important to carry out exploratory lab and practical tests at every location in order to assess what the anticipated effect is and what dosage is required in order to achieve a particular effect. Locations with high PE consumption will be the first to qualify for exploratory studies.


Sources


D. Berkhof, L. Korving, “De invloed van kationen en beluchting op slibontwatering” (The influence of cations and aeration on sludge dewatering), STOWA report 2016-11, ISBN no. 978.90.5773.712.1

Novak, J. T., Sadler, M. E., & Murthy, S. N. (2003). Mechanisms of floc destruction during anaerobic and aerobic digestion and the effect on conditioning and dewatering of biosolids. Water Research, 37(13), 3136-3144

Sobeck, D. C., & Higgins, M. J. (2002). Examination of three theories for mechanisms of cation-induced bioflocculation. Water research, 36(3), 527-538.

DWA (2008), Merkblat M-383, Kenwerte der Klärschlammentwässerung, ISBN no. 978-3-941089-29-7.

^ Back to start

SEWAGE SLUDGE

Cheaper processing

Knowledge journal / Edition 2 / 2017

Monitoring with fibre-optic cables in streams shows local effects and heterogeneity in water temperature


The water temperature is a determining factor for the ecological functioning of streams. The stream temperature was continuously monitored in two streams in Twente using long fibre-optic cables.

The water temperature in streams influences (bio)chemical processes, the presence of species and the functioning of ecosystems. The water temperature of streams is influenced by processes both at the surface and subsurface. On one hand, the air temperature and direct or diffuse radiation causes heating or cooling, whilst on the other hand seepage and diffuse exchange with the stream bed result in regulation of the water temperature.

There is currently little knowledge about the interplay between these local processes and particularly the role of seepage, despite the fact that temperature is an important factor for the surface water quality. Insight into the heat budget of stream systems is required in order to be able to take the right steps to manage the stream temperature and therefore the ecology, particularly in view of future climate change.
Temperature measurements with fibre-optic cables were carried out in order to locate seepage and understand the role of seepage on stream temperature in relation to other factors. This technique - Distributed Temperature Sensing (DTS) - was used to measure temperature continuously in both time and space . This way, the spatial changes in the water temperature as a result of differences in morphology, flow speed and riparian vegetation were measured, together with the effect of local seepage. These measurements were carried out within the European MARS project, within which research is done on the effect of combinations of stressors on aquatic ecology. Between summer 2016 and the start of 2017 the DTS temperature measurements were carried out in two streams in Twente: the Elsbeek at Losser and the Springendalse Beek. Fibre-optic cables with a length of 1.5 km were placed in the streams which collected the water temperature each metre of the cable every half hour.

Springendalse Beek: a spring-fed stream

The Springendalse Beek springs on the Ootmarsum moraine, and flows through the nature reserve ‘Het Springendal’ for the first 2 km. The area features a number of seepage-lakes which discharge into the stream. The measurements were carried out from approximately 250 m from the source of the stream to around 1400 m downstream. Figure 1 shows the day and night water temperature for a warm summer day and a cold winter day.

Figure 1. Day and night temperature measurements of the Springendalse Beek from upstream to downstream (left to right) in both summer and winter show the influence of a tributary (b), seepage-lake (c,e,f) and groundwater seepage (a, d). At these locations the temperature either makes a step or has a different warming/cooling pattern. The dots are measurements from independent temperature loggers.

The measurements in Figure 1 start around 300 m downstream from the source of the stream, where the water temperature in both summer and winter is approximately 10 degrees Celsius. The cause of the constant temperature is that the groundwater has a temperature of around 10-11 degrees and does not fluctuate much over the year, and as a result of the large seepage flow this temperature is still present when the groundwater reaches the surface. On a warm summer day, the groundwater-fed stream heats up in the downstream direction while on a cold winter day the stream cools down.
A tributary enters the stream at point b. The area features a number of seepage-lakes, which are lakes fed by groundwater which discharge into the stream (Figure 1: c, d, f). The influence of the weather can be seen in these slowly draining lakes: in the winter the lakes are responsible for a cold inflow into the stream, and in the summer radiation from the sun causes the seepage-lakes to warm up, which is particularly clear at the 2nd source lake (Figure 1: e). What is noteworthy is that the 1st source lake also provides a cool inflow on a warm summer day (Figure 1: c). Measurements of the isotope Radon-222, which is an indicator of recent groundwater seepage, show that this temperature difference is the result of the fact that the water spends a shorter time in the 1st source lake than in the 2nd source lake, and is therefore heated less by radiation and warm air. The 2nd source lake is much larger and deeper than the 1st source lake.

A significant inflow of groundwater can be identified from the measurements because the stream cools in summer and warms up in winter. The difference in the temperature of seepage can clearly be seen at location a in Figure 1, where the fibre-optic cable is looped through a spring directly next to the stream which provides a more constant water temperature. Variations in the stream's heating/cooling curve indicate that significant seepage is taking place and can be seen at various locations in Figure 1: around the spring at a where the cooling is diminished in winter, downstream of source lake c where the temperature rises in winter, and at point d where the stream stops warming in summer and the temperature increases rather than decreases in winter.

Vertical temperature measurements in the stream bed and measurements with seepage meters in Het Springendal showed seepage fluxes of 86 to 490 mm/d. One important observation from these measurements is that there is great heterogeneity within a stream profile: there are locations where seepage takes place around one bank of the stream whilst water infiltrates on the other side. Measurements with Radon-222 also confirm the influence of seepage.

Temperature measurements in the Springendalse Beek show clear differences. The upstream part has a maximum summer temperature of 14 degrees, and is above 6 degrees on a cold winter day. On these days the downstream part warms up to 17 degrees and cools to around 5 degrees. The constant flow and constant lower temperatures resulting from the supply of groundwater mean that the upper reaches feature cold stenothermic species such as the stone flies Nemoura cinerea and Amphinemura standfussi and the midges Heterotanytarsus apicalis and Heterotrissocladius marcidus (Verdonschot et al., 2002).

The Elsbeek at Losser: a stream through varying agricultural terrain and woodland strips

The Elsbeek at Losser is a typical Dutch lowland stream which primarily flows through agricultural terrain. The measurements in the Elsebeek particularly show the effect of shade: where the stream flows through open fields, it warms by a couple of degrees, after which the stream cools again in the shaded areas (Figure 2). In this, the speed of flow, the depth of the stream and the occurrence of pools are also important. Between 1400-1200 m the stream has deep, slow-flowing pools, which cause cooling because the water temperature is buffered throughout the day in this body of water. In the open area between 900-800 m the stream warms up, and this warming accelerates between 800-700 m when the stream passes through an open and more slowly flowing part. After this, the water cools down again in the wooded area. Unlike the Springendalse Beek, the DTS measurements show no clear influence of seepage on the temperature of the Elsbeek. That is not to say that there is no seepage, just that it is too marginal for any effect on the water temperature because the seepage flow is too small in relation to the stream’s flow.

Figure 2. Summer temperature measurements of the Elsbeek from upstream to downstream (left to right) show the influence of shade in conjunction with flow velocity and stream depth. The circles are measurements with independent temperature loggers.

The measurements in the Elsbeek show that the temperature can vary significantly even over small stretches as a result of flow speed, depth and shade. Seepage measurements in November 2016 showed a seepage flow in the downstream part of the Elsbeek of around 150 mm/day, but no seepage or even infiltration were measured in other parts of the stream. Radon-222 measurements showed no significant seepage, and the vertical temperature measurements showed great heterogeneity, like in the Springdalse Beek.

Groundwater and surface processes steer the stream temperature

Whilst the measurements in Het Springendal show clear buffering of the temperature by groundwater, the temperature of the Elsebeek is mostly determined by solar radiation and air temperature combined with the stream's depth and flow speed. Groundwater causes a lower maximum temperature in the summer and higher minimum temperature in the winter. The measurements shows that the heterogeneity of the stream temperature is great, and this heterogeneity can be measured with the aid of DTS measurements. These anomalous locations and temperature extremes could actually provide specific habitatfactors which are required for (rare) aquatic species. Further analysis of the measurements will focus on the effect of shade and the quantification of the effect of seepage on the stream temperature.

Better understanding of the groundwater and surface water temperature contributes to achieving WFD targets, because more efficient restoration steps can be taken. Better system understanding can - for example - help guide the restoration or retention of ecologically favourable water temperatures in surface waters against the backdrop of a rise in temperatures as a result of climate change. To maintain seepage zones, which also have a positive effect on the base flow and water quality, it is important that groundwater is included in management plans. Alongside detecting seepage, the DTS technique can be used for many other applications such as identifying drying of streams, stagnation, sedimentation, (illegal) discharges, leaking sewers and the effect on water temperature of measures such as the planting of riparian vegetation.

Vince Kaandorp
(Deltares)
Perry de Louw
(Deltares)
Pieter Doornenbal
(Deltares)

Summary

The water temperature is a determining factor for the ecological functioning of streams. The stream temperature was continuously monitored in two streams in Twente using 1.5 km-long fibre-optic cables. Because seepage causes a buffering of the stream temperature, these measurements have been used to detect locations with significant groundwater seepage. Shade also has a clear effect on the stream temperature. It is important to manage stream water temperature in order to achieve WFD targets and make streams climate-proof. This technique allows the stream temperature to be measured on a fine scale, and provides insights into the heterogeneity of the stream temperature which is important when intervening in the water system.


Literature


Verdonschot, P.F.M., van den Hoek, T.H., van den Hoorn, M.W., 2002. De effecten van bodemverhoging op het beekecosysteem van de Springendalse beek (The effects of a raised bed on the stream ecosystem of the Springdalse Beek). Wageningen. doi:1075

^ Back to start

STREAM TEMPERATURE

Use of fibre optic cables

Archive


Edition 1/2015


Edition 2/2015


Edition 1/2016


Edition 2/2016


Edition 1/2017

ARCHIVE

Previous editions

Knowledge journal / Edition 2 / 2017

ABOUT WATER MATTERS

The knowledge section Water Matters of H2O is an initiative of


Royal Dutch Waternetwerk
Independent knowledge networking organisation for and by Dutch water professionals.


Water Matters is supported by

ARCADIS
Global natural and built asset design and consultancy firm working to deliver sustainable outcomes through the application of design, consultancy, engineering, project and management services.


Deltares
Independent institute for applied research in the field of water, subsurface and infrastructure. Throughout the world, we work on smart solutions, innovations and applications for people, environment and society.


KWR Watercycle Research Institute
Institute that assists society in optimally organising and using the water cycle by creating knowledge through research; building bridges between science, business and society; promoting societal innovation by applying knowledge.


Royal HaskoningDHV
Independent international engineering and project management consultancy that contributes to a sustainable environment in cooperation with clients and partners.


Foundation for Applied Water Research (STOWA)
Knowledge centre of the regional water managers (mostly the Water Boards) in the Netherlands. Its mission is to develop, collect, distribute and implement applied knowledge, which the water managers need in order to adequately carry out the tasks that their work supports.


Netherlands Water Partnership
United Dutch Water Expertise. A network of 200 Dutch Water Organisations (public and private). One stop shop for water solutions, from watertechnology to coastal engineering, from sensor technology to integrated water solutions for urban deltas.


Wageningen University Research
Research institute that contributes by qualified and independent research to the realisation of a high quality and sustainable green living environment.

ABOUT WATER MATTERS