CONTENTS

Knowledge journal / Edition 2 / 2015

PREFACE

Water Matters: the Dutch water sector has a lot to offer!

What does the Dutch water sector have to offer? What new knowledge is being developed? And how can we practically use that knowledge, in or outside of the Netherlands? That is the main topic for this Water Matters, the half yearly knowledge journal of H2O, the best-known Dutch medium in the area of water. We present the second edition, containing once again ten valuable articles.

Like the monthly journals H2O and H2O-Online, Water Matters is initiated by the Royal Dutch Water Network (KNW), the independent networking organisation for water professionals in the Netherlands.
The publication of Water Matters is being supported by the Dutch water sector’s main players, of which the Founding Partners are Alterra Wageningen UR, ARCADIS, Deltares, KWR Watercycle Research Institute, Netherlands Water Partnership (NWP), Royal HaskoningDHV and Foundation Applied Science Water management (STOWA). Their aim for Water Matters is to make new applicable water knowledge available for a large audience of water professionals.

The Netherlands Water Partnership (NWP), the networking organisation of circa 200 cooperating (both public and private) organisations in the water sector, makes this English edition possible. You can easily share the articles in this digital magazine with other parties interested. The 'Archive' function (on the right) enables easy access to the archived articles from former editions of Water Matters.

We hope you will enjoy reading what the Dutch water sector has to offer in this second edition of Water Matters.

Monique Bekkenutte Publisher (Royal Dutch Water Network)
Huib de Vriend Chairman editorial board of 'Water Matters'

PREFACE

What do we have to offer?

Knowledge journal / Edition 2 / 2015

Dike monitoring: improving insight in actual strength of embankments

The Netherlands has a strong reputation regarding to water safety. However, flood defence behaviour – under different circumstances – is still hard to forecast. So occasionally we choose to be on the safe side and carry out dike reinforcements that are probably unnecessarily severe sometimes. Fortunately our understanding of dike behaviour is increasing.

The Dutch water boards have been monitoring their flood defence for decades now. This is called Dike watching – observing the condition of the dike with nothing more than the bare expert eye. Subsequently this method was complimented with height measurements and water level measurements. Useful, but still often supplying too little information on water barrier and soil.

Meanwhile new well-tested sensor techniques for dike monitoring have become available, such as infrared sensors, deformation measurements based on satellite data, 3D-scanning, ground radar and/or stereo photography. By smartly combining these new techniques with data obtained from long-standing techniques (such as drillings, cone penetration, monitoring well pipes and water pressure meters), reliable information on the actual behaviour of dikes can be generated, under a great diversity of pressure circumstances.
This type of monitoring is not always the most efficient. Monitoring is not possible or useful under every condition. However in a number of specific situations a tailor made dike monitoring programme can produce valuable information that can quickly earn its keep.
Use of this information makes it possible to optimise dike reinforcement design and flood defence management. In certain situations management for instance management measures, combined with intensive and long lasting monitoring of a flood defence, can turn out to be even more effective and remarkably less expensive than dike reinforcement.

Infrared measurements. In this case at the Wadden, but also applicable for efficiently monitoring drought of peat dikes during a long period of drought


Projects

Based on objective measurements, a well-designed and gradually implemented monitoring programme can give a detailed impression of the vulnerable spots prior to the occurrence of one or more failure mechanisms in a flood defence.
For instance ‘from coarse to fine’ starting with a number of measurements carried out in repetition on a longer distance at the dike surface, followed by more detailed ‘point’ measurements inside of the dike, at those spots were the highest added value of these measurements can be expected. Some recent projects support this approach.

In the past few years an intensive dike-monitoring programme has been implemented at the Ommelandersea Dike in the province of Groningen (between Eemshaven and Delfzijl) carried out by the Foundation Floodcontrol/IJk Dike. For many years governments, knowledge institutes and private parties have been cooperating in this foundation for the development, testing and validation of innovative sensor techniques for dike monitoring. Such validated techniques are practically applied in so called ‘Live dikes’. The Live dike Ommelanderseadike uses several monitoring techniques, such as infrared sensors and advanced sensors for measuring pore pressure and temperature. Earlier this year a so-called ‘stress-test’ has been carried out at this dike; for the duration of four weeks the dike was artificially extremely burdened.
The local Dike Monitoring and Conditioning (DMC-) system was applied here, deployed in reverse for this test: instead of draining the water, water was infiltrated in the dike. During this test the dike was closely observed by use of different monitoring techniques like infrared measurements that can detect excessive humidity/marshes at the dike surface.

Optimal design

It appeared that this dike – disapproved at final assessment – in practise turned out to be significantly stronger than was presumed, also in case of heavy pressure. Apart from the possible consequences of earthquake problems in this area, the measurement data from the monitoring program provide important information for optimal design of planned dike improvement. Besides this, infrared measurements indicated that the excessive marshes detected at the start of the test, developed to sand-carrying wells during the testing period. This shows that infrared surface covering measurements can also have a forecasting value regarding the early warning for risky sand-carrying wells.

Based on long-lasting, real-time sensor measurements of pore pressure at the Watergraafsmeer Dike (Amsterdam), it appeared that significantly less fluctuations occur in the flood defence level (the phreatic line) in the dike, whereby the defence is significantly stronger than had been calculated originally. Partly based on these measurements a design of the reinforcement is now being optimized, taking less space and facilitating more effective management.

Recent measuring at the embankment at the dike ring Heerhugowaard ascertained that extreme flowing seepage water also occurs on other spots than the provisional testing results had indicated. Besides the electrical conductance of the water was measured for the determination of the origin of the seepage water (from the drainage-canal or from deeper soil layers). This information is used as important input for the design of the reinforcement of this embankment.

Another recent project is the Waddenzee dike section at Ameland. Partly based on data from measurements of heights of rise, pore pressure and infrared measurements; it was decided not to reinforce this disapproved dike section. In practise this dike appears to be stronger than previously expected, even under extreme circumstances with combinations of spring tide and storms. Measurements were carried out here also under these extreme circumstances. The dike management is being further optimized, partly with the help of monitoring techniques.
In cooperation with the Technical University of Delft, at this dike section at Ameland an initial version of a numeral simulation model is being developed to connect stream flows of seepage water to temperature change in the dike body, based on heat exchange over time. In near future this model will be further developed in a research programme in cooperation with the Technical University of Delft.

During extreme circumstances and (near) emergencies, continual sensor dike monitoring can provide important information for crisis management on a real-time basis. This applies to imminent high water as well as to (increasingly) long-term drought.
During periods of (extreme) high water, alongside rivers or coastal areas, possible problems in the field of piping, micro-instability and/or deformation can be accurately detected and monitored by infrared sensors. This technique can be used for a continuous, real-time monitoring of critical situations at the embankment, to increase the insight in the real force of the dike in such extreme circumstances. Moreover, measurement data can be read and processed elsewhere, when the embankment is no longer accessible for inspection.

The possible desiccation danger of peat dikes can be efficiently monitored with use of the same infrared technique during a long term period of drought, of course in combination with an increased dike alert. This is successfully shown during measurements over several periods of long term drought at De Veenderij near Amsterdam. With the use of this technique an increasing number of dike lengths can be monitored and controlled at lower costs.

More effective managing and maintenance

Periodical, full scale executed monitoring of the behaviour of some embankments that are known to be (very) vulnerable, can add value to a more effective and more efficient management and maintenance. In combination with regular periodical inspections and data from measurements from well pipes or pore pressure meters, several problems can be detected and solved in a very early stage, mainly in the area of marshland/piping, micro instability or deformation.
New data from regularly actualised measurements can help the manager to respond to new developments regarding legal tests and the annual duty of care, or concerning the introduction of asset management and/or life cycle costing.

The vulnerability of the embankment can strongly increase due to temporary decreased stability during the realisation of dike enforcements or at (major) maintenance activities. In these situations it can be useful to closely monitor the actual behaviour of the embankment with the use of a tailor-made, temporarily dike monitoring program.
These measurements can also deliver much information on the future behaviour of the embankment under extreme circumstances. For instance during enforcement activities pore pressure in lower soil layers can increase significantly as a result of sand supplementation at the foreshore or clay quantity. Measuring embankment behaviour under these circumstances can produce useful information for determination of the failure risk of the embankment during prospective extreme situations. This information can also be used for other, comparable embankments.

Besides measurements to the embankment itself, monitoring techniques offer a cost effective solution for testing of nwo’s (non-water retaining objects, such as trees, cables and pipes, buildings) and in the embankment – in the years to come – a huge challenge for water boards. At a recent pilot at Waternet, the water cycle company of Amsterdam, a new specifically designed program of data collection and processing has successfully indicated that the influence of nwo’s on the stability of the embankment can be tested faster, more effectively and significantly cheaper than when based on traditional methods. This programme uses data already available at Waternet, complemented and validated with new data from advanced measurement techniques. This makes it possible to execute nwo-tests in a simple and automatic way, based on the existing regulations, for very large numbers of nwo’s. This pilot has successfully proven that about 85 percent of the nwo’s concerned can be tested automatically. This automatized nwo test is fully scalable and reproductable.

Jeroen Mes
Niek Reichart
The authors are managing directors of Dike Monitoring Netherland (DMN) a joint organisation of ARCADIS and Intech Dike Security Systems.

Background picture:
Monitoring at Ameland, the Waddenzee Dike. A first version of a simulation model for the connection of seepage water flow rates to temperature changes in the dike body, based on heat exchange in time.

Summary

Monitoring embankments, in combination with new (sensor) techniques and current measurement methods, can in some situations lead to a better insight in the actual behaviour of embankments, under varying circumstances of pressure and time. However, dike monitoring is not useful or possible anywhere and anytime. A tailor made dike-monitoring programme, which focuses on the possible failure behaviour of an embankment, can in certain situations supply important components for design and priority setting of enforcement challenges. In some critical situations and (near) emergencies – both at extreme high water as in case of long term drought – continuous dike monitoring based on sensor techniques can supply important information for real time based crisis management. Embankment behaviour measurements that are regularly actualised can support the embankment manager in handling new developments in the field of the annual duty of care, and at the introduction of asset lifecycle management. Smart use of existing databases of water boards, combined with data from a limited number of additional measurements, non-water retaining objects (nwo’s) such as trees, buildings and pipes can be tested in an automatized, scalable and reproducible way.

^ Back to start
DIKES

Monitoring strongly improved

Knowledge journal / Edition 2 / 2015

Dikes on peat-soil:
a strongly improved
design method

The quality of over 33 kilometres of the Markermeer dikes between Hoorn and Amsterdam was found to be insufficient and need to be reinforced. Since these dikes are partly on peat soil, based on current calculation rules, relatively strong stability verges were considered. Research has shown however, that in practise dikes on peat soil are often stronger than current design calculation methods indicate. Cause for the development of an improved design method for this type of dike.

For decades now the stability of dikes has been monitored but still it appears to be difficult to establish strength parameters for especially humus clay and peat layers, in other words: layers that contain many organic substances. The discussion focuses on the question: how do laboratory tests need to be executed and interpreted to become representative for the behaviour of the ground layer the samples for these tests were taken from.

To help this discussion forward Deltares has, in close cooperation with the water board Hollands Noorderkwartier and the Department of Waterways and Public Works carried out a research titled ‘Dikes on peat’. This research focuses on the large-scale field-tests and the development of a design method for peat dikes. The field-testing was executed in 2012 in the area of Uitdam in Noord-Holland. The results have now been translated into a method specially designed for the Markermeer dikes justifying the actual peat strength in that area.


Field trial activities

In every day engineering practice strength characteristics of soil is determined with the use of laboratory tests. For all sorts of soil it applies that there needs to be a translation of the parameters that were determined in the laboratories according to small samples of the total soil layer behaviour at the location.
For peat this translation is complex, due to the large heterogeneity in a peat layer, the fibre structure and the low tensions in peat. The latter requires relatively high measurement accuracy in the laboratory in order to lead to sufficient reliable results.
To acquire a better understanding of the difference between the strength measured in the laboratory and the actual strength of the peat layer in the field, five large field trial activities have been carried out in the surrounding environment of the Markermeer dikes (in the hinterland). During these trials a large part of soil was constantly being burdened up to the moment the soil collapsed (see picture). The volume of the soil part was comparable to the volume of a small dike displacement.

Prior to the field trials, thorough laboratory research had been carried out. Based on these investigations several different testing approaches, such as Direct Simple Shear DSS (see picture) and triaxle tests and interpretation methods were used to determine the parameters for the peat strength. Using both drained (presuming water drainage through pores) and undrained (presuming pore water cannot be drained) methods. For stability analysis this makes a difference according to the speed of an occurring displacement. A displacement that arises fast enough for minimal consolidation alongside the slip plane is considered to be an undrained displacement.

Subsequently these parameters have been imported in different calculation models Bishop, LiftVan, Ending Elements Method) for the forecasting of the failure mode. Providing a total of seven different approaches, each with another combination of laboratory research methods and calculation models. Besides the laboratory research also field penetration measurements (cone penetration and convex probe measurements) were performed. Results were compared to the field trials results and the laboratory tests results. Finally the different testing phases were recalculated. It was analysed which calculation model best matches the ascertained failure behaviour. All these factors together (laboratory research, field trial and calculation models) determined the strength of the peat.

Stronger than expected

Field trial results indicate that peat is stronger than accounted for in the actual reinforcement design, in accordance with the prevailing guidelines (Zwanenburg, 2013). The analysis of the field trials shows that the undrained strength characteristics are more in line with the observations from the field trials than the drained strength- characteristics. The methods emerging from the undrained approach lead to significantly more strength at low tension and are therefore more in line with the strength for peat that was detected in the field trials.
In addition the prevailing guidelines are based on triaxle tests for the determination of the strength characteristics. From the comparison of the results of the field trials and the seven procedures for the determination of the strength characteristics of peat, it appears that the DSS-trial (in combination with undrained qualities) aligns better with the results of the field trial. The prevailing method leads to a significant underestimation of the strength that has been perceived in the field trials.

Field trial: peat is being increasingly burdened until collapsing

Analysis of the failure cause shows that peat acts differently from the way actual calculation models for determining stability suppose. Such as the manifestation of the straight slip planes, instead of the curved planes most models calculate with (Zwanenburg, de Bruijn & de Vries 2012). Therefore besides the calculation models LiftVan and Bishop the model Spencer-Van der Meij was applied as well. The Spencer-VanderMeij method acknowledges the straight slip plane and is therefore best capable of finding the determinative slip plane. Calculating with use of the Spencer-Vander Meij method is considered to be a refinement of the calculation results of the methods Bishop and LiftVan.

Implementation

With the use of the field trial results the method of transforming relatively small-scale laboratory test results to the behaviour of a total soil layer has been validated and improved. However, the results of the field trials are not necessarily practical applicable.

DSS-test part of determination of strength and behaviour of the peat in the new designing method

First of all, the range of strength characteristics and soil heterogeneity must be taken into account. A transformation of characteristics that were locally found to other, not sampled cross sections and embankment extension must take place.
A secondly important reservation relates to the accuracy of the DSS-testing: the low pressure in peat imposes high demands to the accuracy of the execution of the DSS testing. Not only regarding to measurement accuracy, but also to the influence of for instance sample disturbance.

These comments are included in the development and foundation of the improved design method for dikes on peat-soil (Zwanenburg 2014). Protocols for the execution of DSS-testing on peat and correlations based on four calibration locations alongside the Markermeer dike were composed, for the transformation of the locally found strength features to other cross sections.
These correlations have specifically been composed for use during the calculation of the stability of the Markermeer dikes. The method describes the full design line from parameter determination up to composition of the dike reinforcement design and is made up of eight steps. The first seven steps determine the 0-variety: the calculated stability of the current situation. In case of insufficient stability, the dike reinforcement is designed subsequently.

Step 1 - Choose profiles
Step 2 - Carry out field activity
Step 3 - Carry out laboratory tests
Step 4 - Compose correlations
Step 5 - Determine calculation parameters
Step 6 - Determine other starting points
Step 7 - Design 0-version
Step 8 - Design dike reinforcement

The essence of the method consists of carrying out field penetration measurements in each of the cross sections that are to be calculated. Within the calibration fields’ comparisons between the field penetration measurements and the completed laboratory research were drawn. Based on results here, correlations were composed. Measurements from each profile must be made available to reduce uncertainty elements in the determination of the peat soil strength features. With the use of the correlations the field penetration measurements are translated to strength profiles in the depth. The strength profiles are then used in the stability analysis for dike reinforcement design.

With regard to the current design calculation methods the method is innovative on a number of points. Most important the parameter determination (DSS-test and undrained shear strength) of the peat layer and the additional use of the design model Spencer-Vander Meij for the stability analysis. Finally, in view of a certain spread in soil characteristics and uncertainties in model calculations, a safety margin for the design calculations has been determined.

Impact of new knowledge

With the improved design method for dikes on peat soil the strength and the behaviour of peat can be calculated appropriately. The design method is in line with the developing Legal Test Instrument (WTI) that will become effective in 2017 in the Netherlands. More insight in the peat strength can lead to less expensive and less radical reinforcement measures. It is to be expected that at some places a leaner reinforcement could suffice. Potential savings that will result are still difficult to predict.
The team working on the reinforcement of the Markermeer dikes uses the improved design method dikes on peat for new dike reinforcement design calculations. The calculation results are expected in the winter of 2015.

Goaitske de Vries
(Deltares)
Cor Zwanenburg
(Deltares)
Bianca Hardeman
(Department of Waterways and Public Works)
Huub de Bruijn
(Deltares)

Background picture:
Part of the Markeermeer dikes between Amsterdam and Hoorn, that need reinforcement. But how? And at what costs?

Summary

Over 33 kilometres of Markermeer dikes between Hoorn and Amsterdam have found to be insufficient and in need of reinforcement. These dikes are partly grounded on peat soil. Geotechnical expertise and area experience suggest that dikes on peat-soil are in practise stronger than current design calculation methods indicate. This suspicion was approved by practical research, which shows that the strength of the peat is stronger than can be analysed from the prevailing guidelines for strength characteristics determination. Field trial results have been transformed into a design method focussing on the Markermeer dikes in compliance with the peat strength. Regarding the current calculation rules, the method is innovative on several points. Most important are the parameter determination (DSS-test and undrained shear strength) of the peat-layer and the complementary use of the calculation model of Spencer van der Meij in the implementation of stability analyses.


Literature


Zwanenburg C., Bruijn H.T.J. de & Vries G. de ( 2012) Final report Dikes on Peat – Practical Research.

Zwanenburg C. (2013) Determining force characteristics of peat: a comparison of laboratory tests and field trials. In: Geotechniek, July 2013, p26 (in Dutch).

Zwanenburg C. ( 2014) Endreport Dikes on Peat – Method for the determination of macro stability Markermeer dikes (in Dutch).

^ Back to start

DIKES ON PEAT

Design method strongly improved

Knowledge journal / Edition 2 / 2015

A smarter sludge digestion technique

More energy from wastewater

A wastewater treatment plant that produces all energy it needs or even more, is called an Energy Factory in the Netherlands. The number is still increasing. The concept has also stimulated innovative concepts in sewage sludge digestion. Improved sludge digestion can lead to treatment plants with a much higher degree of energy efficiency. An example of such a new concept is the innovative technology Ephyra®. In this article, research on this concept is reported.

For the digestion of sludge produced in wastewater treatment several options are available. The traditional method is based on mesophilic sludge digestion, in a completely mixed digester with a process temperature varying from 30 to 35 °C. Currently, several techniques are available to improve the sludge digestion process resulting in improved solids degradation, more biogas production and a better dewatering result.
Processes like ultrasonic pre-treatment of sludge, thermophile digestion (at temperatures of around 55 °C) and thermal hydrolysis (improving degradability of organic materials by pre-treatment at high temperature and pressure) are examples that have been implemented in the past few years with varying degrees of success.
Each of these technologies has its advantages and disadvantages, and the choice for a specific technology may depend on sludge composition, plant size and specific local conditions.

Royal HaskoningDHV surveyed the available technologies and concluded that in the Netherlands, and certainly abroad, a potential market for an optimised sludge digestion technology is available. The improvement is not only resulting in a more efficient sludge digestion process, with higher biogas production and better dewatering results. Even more important in the new concepts are parameters such as lower investment costs, lower management and maintenance costs, simplicity and larger robustness.
Royal HaskoningDHV expects to realise these improvements with the use of two new technologies (Ephyra® en Themista®).
How is such a renewing technology developed and how can it be proven that it will function without excessive risks taking for one or more parties when implementing these technologies?

The developing process starts with a business plan to explore feasibility. To test and evaluate this case successively laboratory research, a pilot investigation and a demonstration plant are carried out. This article describes this process for the Ephyra® technology up to and including the results of the pilot research.

Ephyra® is an advanced wet sludge digestion process consisting of different compartments according to the plug flow principle. Ephyra® technology was inspired by practical examples of the German digestion concept Hochlastfaulung that achieves a high degradation efficiency. The German concept however, has a few important disadvantages, such as: high building heights, high costs and sensitivity for clogging. In the technical implementation Ephyra® has been developed to circumvent these disadvantages. In addition, several control options have been incorporated, ensuring improved and robust performance.

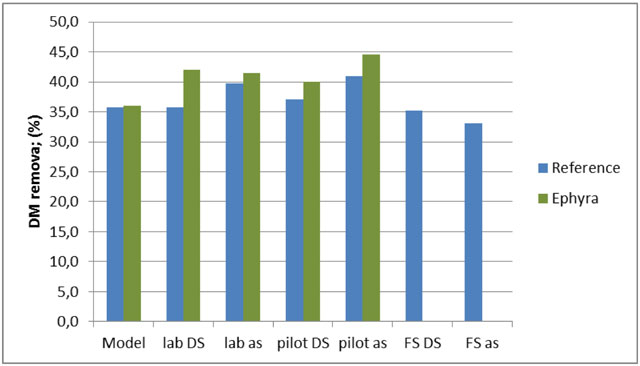
The graphs indicate a comparison between the reference (traditional sludge digestion) and Ephyra®. The degradation of dry matter (DS) was based on measurements of the dry matter concentrations and the inorganic fraction (ash) of sludge before and after digestion. The data are for laboratory and pilot research as well as the full–scale digester at Tollebeek.

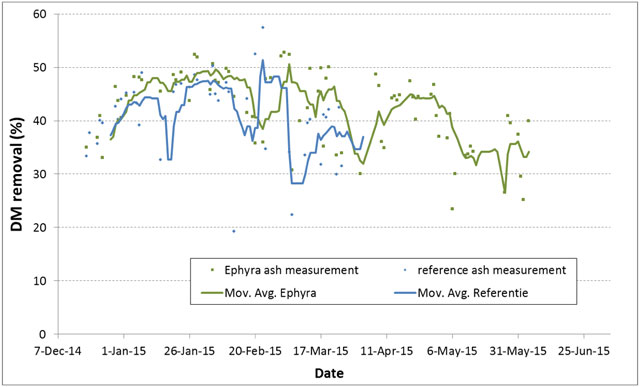
The top graph shows the degradation of dry matter according to the initial model calculations, and the calculated averages from dry matter (DS) measurements and measurements of the inorganic fraction (ash) of sludge before and after digestion. Below graphic shows the course of the dry matter (DS) degradation calculated from measurements of the inorganic fraction (ashes).

In laboratory research with sludge of the five wastewater treatment plants, Ephyra® was compared with traditional sludge digesters as applied in the Netherlands. The research showed that Ephyra® had a sludge degradation efficiency of 38 per cent, compared to about 30 per cent of the traditional reference reactors (in absolute cases an improvement of 8 per cent, relatively 25 per cent). Usually an improved sludge digestion result leads to an improved dewatering result. Based on Dutch sludge dewatering experience, the improvement can be estimated at 2 to 3 per cent (absolute). Since the dewatering result, and the use of polyelectrolyte (PE) to achieve it, are important for the feasibility of the Ephyra® business case, dewatering tests were included in the pilot research.

To explain the better performance of Ephyra® the following causes were hypothesised.
1. Different digester compartments as in an Ephyra® result in phase separation in which of the different sludge digestion processes – hydrolysis, acidification, acetogenesis and methanogenesis – partly occur separately.
2. The developed advanced Ephyra® controller optimizes the different digestion processes which – also in case of varying loading rates – results in a robust and reliable process. With the control, the possible disadvantage of instability as a result of high loading rates in the first compartment is minimized.
3. A longer sludge retention time due to retention of solids, uncoupling hydraulic and sludge retention time.

To test Ephyra® technology and the hypotheses mentioned, a pilot study on the sludge of the wastewater treatment plant Tollebeek (water board Zuiderzeeland) was done, in the period December 2014 up to March 2015. The current situation at the plant was being compared with the future situation with Ephyra®.
The major difference is that in the current situation on Tollebeek the sludge degradability is higher than in a future situation due to a higher percentage of primary sludge. In the future situation also more difficult degradable secondary sludge from the wastewater plant Lelystad will be digested at location Tollebeek.


Dry Matter degradation

The first model calculations indicated that despite a worse degradable sludge the calculated dry matter degradation for the reference (current situation) and the Ephyra® (future situation) were equal. The laboratory research and the following pilot research confirmed these model calculations and showed even better results than expected, as the graph shows.

The results are considered reliable because:
• The dry matter degradation has been determined in two ways: by means of the measured inorganic fraction and by means of the measured dry matter concentrations.
• The dry matter degradation of the current full-scale installation Tollebeek shows results comparable with the laboratory and pilot research for the reference.
• The dry matter degradation in the pilot installation is in line with measured biogas and methane volumes, and also other parameters measured.

The pilot results as shown in figure 2 confirm the business case Ephyra® Tollebeek. However, the results do not yet confirm the claim that Ephyra® realises an extra 25 per cent degradation of dry matter. Therefore, parallel to the pilot plant, a laboratory research was executed, where both the reference digester and the Ephyra® were fed with the same sludge mixture (at first only from Tollebeek and subsequently from Lelystad as well), at similar residence times. This is shown in the second figure.

When the reactors were fed with a different mixture the extra degradation of Ephyra® was about 4 per cent in absolute terms, comparable to the pilot results. That percentage became higher after the fed to both laboratory reactors were the same; finally the extra degradation in Ephyra® stabilized at about 10 per cent (absolute). The better performance of Ephyra® has thus been shown both in the laboratory and in the pilot.

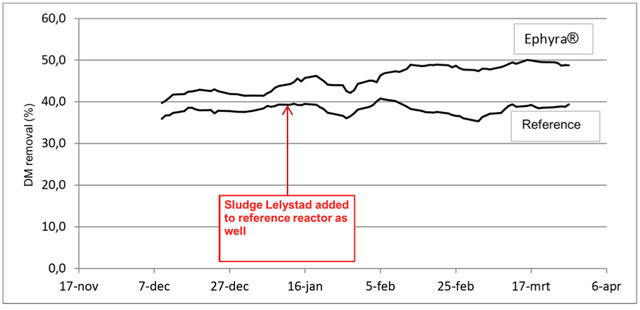
Course of degradation of dry matter (DS) of the reference reactor (traditional sludge digester) and the Ephyra® during the laboratory research over time

Dewatering

In addition to measuring dry matter degradation, two comparable large-scale dewatering tests were carried out on the reference and the Ephyra® sludge.
• Digested sludge of the Ephyra® pilot reactor dewaters significantly better than sludge from the pilot reference reactor. The difference was 2 to 3 per cent dry matter.
• From sludge of the full-scale field installation at Tollebeek the dewatering result was 23.5 - 24 per cent dry matter. Sludge from the Ephyra® pilot reactor resulted in 25 - 25.5 per cent dry matter after dewatering.

During testing it appeared that for a good dewatering the combination of the sludge, the right polyelectrolyte type and dosing, and the correct set points of the centrifuge are crucial for reaching the best dewatering result.

Assessment hypothesis

Let us return to the hypotheses mentioned earlier:

Hypothesis 1: Phase separation occurs
The pilot test confirms the occurrence of phase separation in the different compartments of Ephyra®. There was a clear difference in pH (acidity) and redox potential in the different compartments, the first compartments are more acidic than the latter and also have a higher redox potential, and the fatty acids formed in the first compartment are well degraded in the following compartments.

Hypothesis 2: By controlling sludge streams and recirculation, Ephyra® remains a good controllable process.
Part of the effect of Ephyra® is attributed to phase separation. For a stabile process and a continuous result it is essential to maintain this phase separation also during peak flows. Therefore a special controller has been developed that manages optimal process circumstances by control of the recirculation streams. During the pilot tests several peak loads have been executed showing that the process and the phase separation are maintained resulting in a stable performance of the Ephyra®s

Hypothesis 3: By uncoupling of sludge and hydraulic residence time, the sludge residence time is longer.
Settling tests have been carried out with the sludge of the different compartments of the pilot Ephyra®. These indicated little or no sludge sedimentation. Not even after a 48-hour period. It can be concluded that there are no indications that uncoupling of sludge and hydraulic residence time occurs.

How to proceed?

After nearly four years of laboratory research and half a year of pilot tests, it can be concluded that the positive effect of Ephyra® on sludge fermentation – both in the laboratory as well as in the pilot tests – has been proven. The pilot research confirmed and even improved the laboratory results. Also with regard to sludge dewatering a difference has been demonstrated.
Furthermore, the pilot research confirmed and disproved several hypotheses. This has resulted in a further development of knowledge of the operating principles of Ephyra®. The pilot test has helped in providing insight in a number of occurring phenomena, which will make the design of the demonstration installation more robust.

Dennis Heijkoop
(Royal HaskoningDHV)
André Visser
(Royal HaskoningDHV)
Leo van Efferen
(Watersboard Zuiderzeeland)

Summary

This article describes the comparison of Ephyra® and a traditional sludge digestion in pilot and laboratory research. This research is in fact an interim step in the three years during laboratory research and the future full scale demonstration installation. Both the expected results and the measured results are described together with the formulation and testing of hypotheses on the effects of Ephyra®. The pilot and laboratory research have shown the positive effect of Ephyra® on sludge digestion and dewatering. The pilot research also helped to provide more insight and knowledge in critical design parameters.

^ Back to start
SLUDGE DIGESTION

More energy from wastewater

Knowledge journal / Edition 2 / 2015

Quick analysis of fecal contamination of drinking water

Microbiological drinking water control is carried out by use of longstanding cultivation techniques. With these techniques it takes a long time before the outcomes become known (sometimes about 44 hours). New molecular techniques can indicate bacteria much faster. Water Laboratory North (WLN) has developed methods that can indicate fecal indicators in drinking water within four hours. An added value to the safety of our drinking water.

In the Netherlands, drinking water is safe and reliable. Self-evident to the consumer, but in fact not at all that obvious. In the Netherlands the careful production of safe drinking water makes disinfection with chlorine in the distribution network redundant. This means however, the distribution network has no chemical barrier and that pathogenic material, in case of entering the system due to pipe breaks or leakages, can survive in the water for some time and so contaminate consumers. These situations are reduced to a minimum by rules on hygienic processes and an extensive bacteriological measurement programme.

Primarily hygienic

A hygienic working method after intervention of the distribution network is essential to keep drinking water safe. It is much more effective to prevent contamination than to clean and disinfect afterwards. As it is impossible to investigate all the water it is afterward reviewed whether the working method that has been used was clean and responsible. After an intervention drinking water samples are examined on the fecal indicator organisms E. coli and intestinal enterococci.

So far this is done with the (statutory) traditional growing method. These analyses take at least 16 to maximally 44 hours. In situations where the water is not directly consumed this is not a problem. However, sometimes it is necessary to supply the water immediately after an intervention. In those cases the reliability stays uncertain for at least 44 hours. Generally consumers are advised to boil the water in these cases, but this measure cannot protect all consumers in a risk area. Approximately 80 percent of the people concerned are reached. The other 20 percent run a risk. Therefore the analysis techniques for the fecal indicators need to be accelerated.

Substitute analysis techniques

In the past ten years molecular technique developments have been progressing. Molecular techniques are based on detecting genetic material of the target organism. Molecular techniques are independent of the speed of growth of the micro organism so compared to other grow methods time is gained.
A molecular technique that is often used is the Polymerase Chain Reaction (PCR). Here a specific part of the genetic material (DNA) of the target organism is multiplied by a factor of 1 milliard or more. Labeling the multiplied DNA makes it detectable in high concentrations. In fact, the growing behaviour of bacteria (double continuously) and their formation of a recognizable colony in at least 24 hours is being artificially simulated within two hours.
The PCR-technique is being applied in many industries. In water – for detecting E.coli and enterococci at the level of 1 per 100 millilitres – the technique is unfortunately too insensitive to apply. Therefore a modified method that does not aim at DNA but at RNA has been developed. This technique is known as RT-PCR (Reverse Transcription Polymerase Chain Reaction). WLN adjusted the RT-PCR for the detection of E. coli and intestinal enterococci.

Both quick analysis methods (E. coli and intestinal enterococci) are based on the presence of the 16S ribosomal RNA in the bacteria cell. The amount of ribosomal RNA (rRNA) depends on the physiological state of the bacteria cell, which means that the RT-PCR methods are not quantitative. Bacteria fresh from the gastrointestinal tract are still full of energy and nutrients and in full development. The cells then still contain many copies of the rRNA (some ten thousands per cell). A bacteria cell that has been in the water for some time will no longer show much activity and comes in a resting phase. The number of RNA-copies in this cell will be much lower. Dead or nearly dead bacteria cells contain few rRNA and are thus not indicated in the RT-PCR-analysis.

The fact that the quick analysis method cannot quantify the indicative contamination is less meaningful to the intended application. To detect fecal micro organisms in drinking water it suffices to choose a method that can detect one single bacteria cell in 100 millilitres (or another wanted volume). The presence of E. coli and intestinal enterococci indicates fecal contamination for which action must be taken, regardless of the amount.
To ensure that the water is reliable hygienic, the indicators should analyse both the E. coli as intestinal enterococci. E. coli however is a defined species and genetically very conservative whereas the enterococci is a strongly diffuse genus hard to determine. The challenge was to make a difference between fecal and non-fecal enterococci.

The results of the quick RT-methods compared to the statutory methods for analysis (cultivation) for E.coli (left) and enterococci (right).

The classical growing methods are not very specific however; besides enterococci of fecal origin (intestinal enterococci) they indicate a few other sorts, that possibly originate from feces but are also present in the environment (plants, sand, insects, surface water). The latter group has no direct relation with fecal contamination and therefore neither with pathogens.
Indication of these non-intestinal species in the cultivation is considered a non-preventable growth and therefore possibly a ‘false alert’. Today, laboratories can differ between intestinal enterococci and other enterococci by using the MALDI-TOF technique (matrix assisted laser desorption/ionisation time-of-flight analyser). This technique is very sensitive, but is also dependent on cultivated material.

Validation

Both in case of the E.coli as well as with intestinal enterococci RT-PCR control samples and practical samples have been compared to see whether the results match those of the legal growing methods. De table shows the performance characteristics, determined according to NEN-EN-ISO 16140. The results of the fast techniques and the culture methods are related and amply meet ISO validation requirements.

Practical value quick analysis methods

In Groningen and Drenthe positive experience was gained with the quick E. coli method (RT-PCR E. coli) by WLN. In case of interventions with an increased risk due to circumstances under which the reparations have to be carried out, E.coli presence can be detected within four hours. Since 2010, the classical method as well as the fast method for E.coli is used. In three years’ time 400 samples have been analysed with the RT-PCR E.coli and E.coli growing method (NEN-EN-ISO 9308-1).
Practice has also made apparent that both methods provide comparable results.

The accuracy and specificity of the RT-PCR method in regard to the growing method were respectively 90 and 92 percent, which is comparable to the validation level outcome (table 1). The number of positive samples is somewhat higher at the molecular method than the growing method, but regarding the selectivity of the growing method this was to be expected. Eleven percent of the samples could not be assessed with the RP-PCR method due to disturbance of the analysis by the matrix. Further analysis showed that it concerned a direct fire hydrant sample in most cases.

In the past years, the added value of the quick methods has become evident for the water companies. In some projects that needed large interventions or reparations the water supply became operational much faster than usual, because of the quick insight in the water quality and risks. The following practical situation illustrates this.

At a standard monitoring control of clean water tanks in an area that has to be provided with drinking water, coliforms and enterococcus are detected in a weekend. The MALDI-TOF-technique (showed that respectively Citrobacter freundii and Enterococcus phoeniculicola were concerned. The coliform bacteria is known for its presence in feces and regrowth in water. The enterococcus that was found was no more known than that it was once found on a tropical bird. Based on this information the total distribution area behind the clean water tanks was advised to boil the water prior to consuming.
The next day samples were taken in the distribution area and the clean water tanks for the quick E-coli method and the quick enterococci method. In consultation with the government was decided to take the results of the quick methods as a lead for cancelling or maintaining the boiling advice.
This resulted in the cancellation of the boiling advice just after a second control round, a time saving of almost 40 hours with regard to the classical growing methods.

How to proceed?

In the Dutch drinking water industry the added value of the molecular techniques in monitoring water quality is agreed upon. It is evident that the use of these new techniques will increase in years to come. These methods for detection of fecal indicators are a good introduction to more regular PCR-analysis. Currently multiple initiatives are underway for the acknowledgement of the E.coli RT-PCR as a valid method for analysis for detecting E.coli in drinking water, nationally as well as internationally. The first signs are positive and the Netherlands are frontrunner here.

Gerhard Wubbels
(Water Laboratory North WLN)
Gerrit Veenendaal
(Water company Drenthe)
Mark Schaap
(Water company Groningen)
Teo Lijzenga
(Water Laboratory North WLN)
Auke Douma
(Water Laboratory North WLN)

Background picture:
E. coli

Summary

Microbiologic control of drinking water is carried out with the use of classical growing techniques, which take a long time (sometimes about 44 hours) to deliver results. That is no problem when there is plenty of time, but when the water system needs to deliver immediately after an intervention, this causes a lot of insecurity. The advice to boil the drinking water before use generally reaches only four out of five people concerned. New molecular techniques, based on detection of genetic material of the target organism are different from the traditional methods, not dependent on the growing force of a micro-organism. Water Laboratory North (WLN) has developed an existing technique for the detection of genetic material in such a way that in water (level 1 bacteria per 100 millilitres) the presence of E.coli and intestinal enterococci can be detected within only four hours. Research and practice are pointing out the large advantages in time saving that can be gained here.

^ Back to start
FECAL CONTAMINATION

Quick drinking water analysis

Knowledge journal / Edition 2 / 2015

Willows for less expensive and more beautiful dikes

Traditionally willow riverbanks form a characteristic part of the river and fresh water tidal landscape. The creation of intertidal dikes can break waves significantly and reduce the dike height required. But what exactly is the effect of a willow river bank and how could this concept be consistent with the new way of dike assessment in the Netherlands?

Around Fort Steurgat near Werkendam a new primary flood defence was planned. The flood defence was needed because of the flooding of the Noordwaard, an action resulting from the programme Ruimte voor de Rivier (Room for the River) that was initiated in to limit flood of large rivers and to enhance the environment’s value.

The Werkendam flood defence is built in combination with the planting of a river bank (willows) at the riverside according to the concept Building with Nature; using natural processes to add to water safety. At the design of the ‘willow bank dike’ it was presumed that in case of extreme high water levels incoming waves breaks at the riverbank, so the crest of the dike can be less high.

The riverbank dike at Fort Steurgat is a primary flood defence, periodically tested on flood risk. The current legal assessment instrument (WTI 2006) however does not provide in a testing method for such a riverbank dike. This article describes the way in which an assessment for this river bank dike was established and how it can be generalised, taking into account the specific characteristics and the wave reducing effect of the willows on the riverbank.


Exploratory investigation

In 2009 Deltares survey (see bibliography) investigated the possibilities of alternative dike designs, where breakwater vegetation is an integral part of flood defence. An integrated dike design was introduced, assuming that an intertidal area reduces 60 per cent of the incoming wave height (breakwater).
Apart from the fact that in that case a lower flood defence would suffice, neither a traditional hard dike revetment would be necessary, but a less expensive clay revetment with a grass cover would be adequate. That can make a large difference in the construction costs. Furthermore a willow bank dike has more nature value and can be fitted better in the polder landscape if there is enough space before the flood defence.

Testing model

The assessment method that was specifically developed for this purpose is described in the publication Assessment method willow bank dike Fort Steurgat (see bibliography). It concerns a tailor made assessment method, specifically applying to this location. Being ‘tailor made’ this method is part of the new Legal Test Instrument (WTI). Further development however is necessary to make the assessment method less complicated and generally applicable as part of the standard instrument.
The assessment method that was designed for riverbank dikes consists of an assessment of the wave reduction of the willow bank and an assessment of the crest height of the dike. In this case one is free to choose any testing sequence. For instance, when the crest of the dike – without taking the willow bank into consideration – suffices, water safety is guaranteed with regard to this aspect and assessment of the riverbank is not necessary.

Artist impression of a willow bank in front of a flood defence
Source: Robbert de Koning landscape architect BNT


The assessment scheme consists of several steps, from rough to fine. At first a visual inspection is the base for determination of amount of the surface for a willow bank. Then complementary it is verified whether the willows are subject to erosion, disease or damage. Subsequently a calculation model verifies whether the assumption for the minimal reduction of the wave height in the design can be maintained.

When the verification of the calculation model indicates that the reduction of the wave height is minimally 60 per cent the assessment can be continued. In that case field measurements must be conclusive on the height and the density of the willow bank and the number of rootstocks (under stems that stay erect when the branches are cut at the level of half a meter). The vegetation volume in the willow bank indicates the density of the willows and consists of the volume of all rootstocks and branches in the willow bank between the soil surface and the assessment water level.

Height of the willows

For sufficient resistance to the incoming waves the willow branches must be higher than the normative high water level in connection to the dike concerned. At determining this water level the effect of the sea-level rise, the increase of the river discharge and such are taking into account. For the determination of the density sample survey sections in parts of 2 by 2 metres rootstocks are counted and their diameter is measured. Per survey section also at three willows the branches diameters are measured. The results are compared to the design data.

Subsequently starting points and hydraulic boundary conditions are assessed. This implies a comparison of design and assessment framework conditions and the differences in geometrical characteristics of the willow bank between the design and the actual situation.
It must be assessed whether the high water levels used in the design are equal to those applicable during the assessment. Besides, the crest height and effective width of the willow bank should not be smaller than the values used in the design. The effective width of the intertidal area is determined by measuring the width without the paths and corridors in the intertidal area.

The planting of willow cuttings at the Fort Steurgat dike

At the dike around Fort Steurgat one of the most complicating starting points is that the willows cannot become too high and obstruct the view of the Fort Steurgat residents. Willows however grow very fast; so cutting right above the stove knot must take place once every two years. To prevent removing too much of the willow bank due to cutting, its construction is double in strips. Yearly half of the strips are cut to ensure a minimal amount of willow bank. Cutting at the end of the winter guarantees sufficient willow bank at the start of the following storm season.

Broader application

What are the broader possibilities for intertidal area dikes? In 2017 the Netherlands will adopt new safety standards, which are not based on the probability of a certain water level, but on the probability of flood risk of a certain area. As a result of the new standards more dikes will require reinforcement. In the context of a quick scan it was considered where in the flood plains of the river area vegetation (like willows) can have a positive effect on water safety. Eighteen locations were appointed for useful further investigation of possibilities.
In order of the Water board Rivierenland Deltares calculated how much wave reduction is realised by actual vegetation at the toe of the dike under normative conditions. These are the water levels and waves corresponding to the safety standard of the dike body. This study was carried out for the flood plain of the Rijswaard alongside the river Waal in western Noord-Brabant. Also for this area a reduction of wave height of 60 per cent seems to be feasible, with additionally a reduction of the wave period (important with regard to the wave run up against the dike). It will lead to a substantial decrease of the wave overtopping.

The design at Fort Steurgat was based on a reduction of 60 per cent wave height.
However a larger reduction is expected to be possible, but that has to be indicated by a computer model made available for this purpose. The current design uses the vegetation module in SWAN-MOD, version 40.55. This vegetation module however has not yet been calibrated or validated.
Another point of attention is that in view of the program Ruimte voor de Rivier (Room for the river) it was stated that vegetation should not limit the drainage capacity of a river. The programme Stroomlijn (Stream line) limits the acreage vegetation on flood plains.
Recent survey has shown that on many locations current vegetation in the flood plains is not limiting the drainage capacity of the river. Vegetation by breaking waves possibly having a positive contribution to water safety will have to be balanced to a possible negative contribution to water level increase. This also applies to willow intertidal areas.

On balance

Application of willow bank dikes can ascertain that where wave attack is concerned the crest height of a flood defence should be not at all or considerably less raised.
Consequently the available space of the dike and expenses for dike reinforcement are reduced. On the other hand, for the willow bank space must be available and the contribution of a living and dynamic part of the safety solution in the long term must be quantified and guaranteed. Adequate management and maintenance must secure this. A survey for the Water board Rivierenland has indicated that other vegetation types, that are also valuable elements in the river environment, can also add to wave height reduction.

Johan van der Meulen
(Waterboard Rivierenland)
Mindert de Vries
(Deltares)
Marike Olieman
(Department of Waterways and Public Works WVL)
Hans Venema
(Deltares)
Harry Schelfhout
(Deltares)

Summary

Around Fort Steurgat a new dike was built with a (willow) bank area at the meadows. Innovative here is that the intertidal area is built to break the wave attack in extreme circumstances, so that dike design can be less high and less expensive. From field measurements and calculations using a wave model a relation has been determined between the density of the willow bank and the attenuation of the incoming waves. The willow banks established a wave height reduction of minimally 60 per cent allowing the crest of the dike to be build 60 centimetres lower. To test the wave breaking function of the willow bank a testing method and monitoring plan have been developed. Advanced management and maintenance must monitor the condition of the willow bank. Shallow, vegetated meadows, such as willow banks, are expected to limit the space and expenses of future dike reinforcement. Embedding of the rural design and testing instrument is necessary to achieve that.


Literature


Design green wave breaking dike Fort Steurgat at Werkendam, survey (in Dutch), Deltares, Z4832.00, April 2009.

Testing method Fort Steurgat, Deltares, 1206002-000-GEO-0023, April 2014 (in Dutch).

Quick scan Wave breaking vegetation at Stroomlijn, Deltares, 1206002-000-GEO-0005, October 2012.

Quantifying the effect of wave breaking by vegetation on flood plains, June 2015, Deltares, 1220539-000-ZWS-0006.

^ Back to start

PLANT WILLOWS

Dikes better and cheaper

Knowledge journal / Edition 2 / 2015

Roof covering and water management

Are green roofs blue?

Green roofs are hot, also from an urban water management point of view. They capture fine dust and ensure biodiversity, cooling and spatial quality. With regard to water management it is important that green roofs retain rainwater and delay drainage. But how to dimension and scale-up green roofs to contribute to water quality, counter flooding and limit (peak) drainage to surface water?

For (urban) water managers few concrete and usable information is available on the hydrological effects of green (vegetated) roofs. Product suppliers and developers lack clarity on the demands of the functioning of a roof and specifications that determine the hydrologic characteristics of green roofs.

In the fall of 2012 a research started on the experimental roof of the Dutch Ecology Institute (NIOO-KNAW) in Wageningen after the hydrological effects of green roofs and suitable methods to determine hydrologic characteristics and to calculate effects. This research concerns hydrology, temperature and flora and fauna of 45 trial sections, with grind as reference and six different combinations of cultivation and substrates. The research is carried out in cooperation with NIOO-KNAW, Wageningen University, water board Vallei & Veluwe, Rotterdam municipality, ZinCo Benelux, Daklab/BetonRestore, RIONED foundation and STOWA (Foundation for Applied Water Research).


Practical measurements

The cultivation of the experimental roof did not develop well, due to the very cold spring of 2013 that was followed by a dry summer. In the autumn rainfall was rarely large; 326 millimetres in the KNMI-weather station of Wageningen. But then it appeared that the rain gauge was not functioning correctly, and drainage disturbed the water level measurements from the trial sections.
After adaption of the drainage installations, addition two rain gauges, adaption the measurement frequency to one minute and a review of the maintenance plan, in 2014 an appropriate set of data was obtained.
The measurements took place from March to November, not in winter because of the risk of freezing of the installation.

Calculation model

The most important hydrological processes on a roof are water storage, evaporation and drainage. These processes are schematised in a simple water balance model (figure 1). Measurements on the NIOO-roof reproduce well with this water balance model, because the leaking of the water from the substrate to drainage layer lasts relatively short. The effect of the runoff delay over the roof is not taken into account, as it is not measured on the NIOO-roof.
The calculation model is important for decisions based on hydrological effects of green roofs in the long term and during heavy rainfall. RainTools was used; a new calculation tool to simulate the process of multiple reservoir models with rainfall time series and single (extreme) rain events.

Figure 1: Model scheme of a green (blue) roof with a substrate layer (green) and a drainage layer underneath (blue)


Figure 2: Water balance of 25 years of rain of a green roof, for different water storage in the substrate layer


Figure 3: Model scheme of characteristic situation in an residential area with a mixed sewage system


Figure 4: Water balance of 25 years of rainfall (left), shower 10 (middle) and ‘shower Herwijnen’ (right) to a residential area, for various ratios of traditional/green blue roofs

Substrate layer

The substrate and drainage layer differ in functioning and effect. First the long-term water balance of only the substrate layer without drainage layer has been determined. Figure 2 shows the result of the simulation of 25 years of rainfall (De Bilt, 1955-1979, average 800 millimetres per year) and an average month evaporation (according to Penman).

The calculations indicate that already at small water storage of 10 millimetres in the substrate, circa 45 per cent of the total amount of rain evaporates. The figure shows that the larger the substrate storage, the relatively smaller its effect on the decrease of the roof drainage. This is subsequent to:
• Most rain events are small and don’t need large storage to collect and evaporate
• Evaporation is low in winter, which leaves the substrate storage filled and leads almost all rainfall, large and small, to be drained.
At circa 100 millimetre of water storage the substrate can collect and evaporate almost all rainfall in summer. Point of attention is: this rainfall time series shows hardly any extreme rainfall event in the summer.

Substrate and drainage layer

Apart from substrate storage, green-blue roofs have (large) water storage in the drainage layer. To determine its effects, calculations with rainfall series and some extreme rainfall events were carried out for a residential area (figure 3) with a rising percentage of green-blue roofs. In this example the discharge from the drainage layer is limited. The size of the drainage area is not relevant. The characteristics describe the relative proportions of roof and street surface and a common size of sewer storage and drainage capacity.

Figure 4 indicates the result for an increasing percentage green-blue roofs in the residential area calculated with:
• 25 years of rainfall (De Bilt, 1955-1979, average 800 millimetres per year) and an average month evaporation (according to Penman).
• Two heavy rainfall events: a ‘standard rain event 10’ from Sewage guide (35,7 millimetres in 45 minutes) and an extreme ‘rain event Herwijnen’ from 28th June 2011 (94 millimetres in 70 minutes).
Note: this concerns ample dimensioned green-blue roofs, with 20 millimetres of substrate storage, 50 millimetres storage in the drainage layer and limitation of roof drainage to 1.8 millimetres per hour.

Green blue roof effects

Greening of all roofs in a district with combined sewer system has a positive effect on the water quality. Calculations show that the sewer overflow volume decreases from 5.5 to 2.2 per cent of the total rainfall volume and the discharge to the waste water treatment plant diminishes from 72 to 60 per cent.
Greening of roofs also affects the chances of flooding. Greening half of all roofs results in the common drainage capacity of 60 litres per second per hectare to the overflows is not being exceeded. This applies to the rain series ‘De Bilt’. In case of extreme rainfall like ‘rain event Herwijnen’ obviously flooding is calculated, that can also quickly merge to rainwater nuisance and damage.

The yearly discharge of rain to the water system wanes with circa 20 per cent due to evaporation as a result of greening of all roofs in a combined sewer drainage area. This is mainly due to a decrease of the effluent volume from the treatment plant. This effect is largest in summer and less in winter. The overflow volume at heavy rainfall decreases as well, but less than on a yearly basis. During standard rain event 10 the overflow volume diminishes with circa 14 per cent, during rain event Herwijnen with 5 percent. In case of extreme rainfall green roofs have less effect.

Hydrologic characteristics

Hydrological functioning of green roofs concerns storage, evaporation and drainage. The processes in substrate and drainage layer differ:
• The water storage of a wet substrate can only become available again through evaporation. Substrate and vegetation characteristics have limited influence on this process.
• The availability of the water storage in the drainage layer can be well arranged, for instance by limitation or real time control of the drain. Without any form of management of the roof drainage this water storage is non-effective. Evaporation usually plays a minor role in the drainage layer.
Thus, for specifying the hydrologic functioning more than just water storage in the substrate is needed. The characteristics of the water storage in the substrate and the drainage layer, the evaporation as well as the management of the roof drainage need to be taken into account.

In a broader perspective

The research on hydrologic effects of green roofs shows that many other actions for drainage on private property such as lowered lawns or infiltration facilities are more (cost) effective. With regard to water management green (green-blue) roofs are mainly interesting in highly urban areas, in case of poorly permeable soils or new construction projects, where processing of storm water on the plot is not possible. Blue roofs with only water storage, without substrate or vegetation are more effective than green ones. More water storage with similar weight bearing is possible here, water storage is easier to manage and construction costs are lower.

The added values on other themes such as perception, biodiversity, cooling of buildings and environment, together with effects on the water balance make greening of the roof scenery in urban areas so interesting. In many of the other, non-hydrological effects roof water plays an important role, either directly or indirectly through roof vegetation. Further research could aim on the question whether water storage in the drainage layer can limit the heating of the building during the day and whether this water functions as a heat buffer limiting the cooling of the building at night. Another question is to what extent water storage offers possibilities for a more bio diverse roof vegetation.

Show colours

Green roofs with relatively small substrate storage (15 to 20 millimetres) are already holding a relatively large amount of rainwater on a yearly basis. Large-scale application decreases the total discharge to sewer system, waste water treatment and water system especially in the summer period. In wintertime there is no effect. For an effect on the water balance during heavy rainfall green-blue roofs are needed: ample dimensioned roofs, with a minimal water storage in the substrate layer (for vegetation) and a large water storage in the drainage layer (50 millimetres or more) with a real time controlled or limited roof discharge (for instance to 1.8 millimetres per hour). Large application has a clear effect on sewer overflow and the frequency of flooding and limited effect on the hydraulic peak load of the surface water.

Kees Broks
(STOWA)
Harry van Luijtelaar
(RIONED foundation)

Summary

A simple green roof with small water storage in the substrate can contribute a lot to the reduction of the annual flow from roofs to sewage system and waste water treatment plant, especially by evaporation in the summer period. However, its effect is only noticeable when roofs are being ‘greened’ on a large scale. For the processing of extreme rainfall large sized ‘green-blue’ roofs are needed, with large water storage capacity in the drainage layer combined with a controlled roof discharge. An effect on the water balance will only occur when these green blue roofs are constructed on a large scale. In comparison with other measures these green or green blue roofs are generally less cost effective. Blue roofs that only have water storage are more effective than green roofs. Especially the combination with the other effects of green roofs for building and environment make its application interesting.


Literature


Broks, K., H. van Luijtelaar [2015]. Green roofs in closer view.

STOWA, Foundation RIONED, Reportnumber 2015-12 (in Dutch).

^ Back to start

WATERMANAGEMENT

The purpose of green roofs

Knowledge journal / Edition 2 / 2015

A smart solution for flooding, drought and water pollution

Due to climate change measures to prevent damage by flooding and water shortage are being more and more urgent. Often the question arises: is it possible to temporary store peak floods and simultaneously to conserve water in the same area? And is it possible to improve the quality of retention water to guarantee possible re-use of water, nutrients and biomass?

Park Lingezegen is being constructed for recreation, nature development and water storage in the Betuwe area between Arnhem and Nijmegen. A water storage basin has been realized in order to prevent flooding in the neighbouring urban area of Arnhem-South and in the greenhouse horticultural complex Bergerden. In this part of the Betuwe water board Rivierenland is also looking for more storage capacity for water to be used later in dry periods to prevent water shortage damage in fruit orchards and nature in the Betuwe. This water however needs to be as clean as possible.
In the research project RichWaterWorld it is investigated if and how temporary storage of high water peaks (water storage) can be combined with conservation of local water surplus (water retention) and natural water purification. The aim is to support sustainable use of water, nutrients and natural energy within the region.


Actual and forthcoming water balance

Alterra Wageningen UR, MeteoGroup and Eijkelkamp Soil & Water cooperate in finding solutions for the regional challenges concerning water quantity. A regional hydrological system analysis of Park Lingezegen and its surroundings gives insight in the patterns and processes of soil and water. This information has been used as input for an integrated hydrological model, based on the regional ground water model MORIA, used by the water board Rivierenland. For this purpose a surface water module has been added to the model. So the effects of climate change, weather change and the influence of the river Rhine on the regional water system and water balance could be predicted on a regional and local scale. The long term effects of several climate scenarios as well as the short term effects of weather forecast scenarios on the local water balance and water levels can now be predicted.

To validate the results of the hydrological model, field measurements have been executed in a 2-hectare experimental area, which was constructed near the water inlet to a large reed swamp. Sensors register the groundwater levels, surface water levels and soil moisture content. This information is directly available online. Sensor data are regularly checked by observations in the field. The monitoring data, together with data on water levels of the river Rhine at Lobith, are used as input for the hydrological model.
Meteorological observations in the experimental area provide actual information on the amount of rainfall and data needed to calculate the evaporation loss. Data from radar images and weather models are used for multiday weather forecasts. This meteorological information on the actual and forthcoming weather conditions is also available online and used as input to the hydrological model. Based on all these data the consequences of changing weather for water levels and the local water balance for the next fifteen days can be predicted.

Instrument for adaptive water management

Monitoring data from sensors and meteorological instruments, together with data from radar images and weather models, provide a large amount of information. That mass of data is unusable unless it is made available in a coherent and cohesive way. Therefore all weather forecast data are clustered in weather scenarios based on the probability of occurrence, in order to make it possible to anticipate in water management on changing water conditions. The web application Richwaterweb has been developed to store and organize all data for calculating the daily water balance and water levels over a period of fifteen days ahead.
As a result the web application supplies expected water balances and water levels for several weather scenarios (very dry to very wet) and can be used for calculating the actual and future availability of water storage capacity in the next fifteen days.

Bio cascade water purification

Water storage and water retention areas are often developed in (former) agricultural areas, where objectives for water quality and nature development often are not met. As a solution Radboud University and B-Ware Research Centre have developed a bio cascade water purification.
In contrast to well-known helophyte filters and water harmonicas the bio cascade water purification is developed as a regenerative system in which the accumulation of nutrients is prevented. Depending on the field situation a tailor-made bio cascade water purification is developed by cleverly using knowledge about soil processes in relation to waterlogging and desiccation, and about aquatic plants in their function as bio-engineers. In the test location in Park Lingezegen the emphasis in water treatment lies on the removal of nitrogen (N), whereas in the experimental ditches at Radboud University (RU) the emphasis in water treatment lies on the removal of phosphate (P).


Figure 1 shows results from the research in the experimental ditches. It is shown that regardless of season the water quality in the bio cascade increases considerably thanks to the downstream combination of specific biogeochemical processes. Although the chemical nutrient removal rates in winter are slower they still continue throughout the year. Specific statements on residence time and purification efficiencies are expected by the end of 2015, with the completion of a detailed water balance and the analyses of the latest data on water and soil parameters. The same holds for the field trial research in Park Lingezegen.

Charging phase
Generally the bio cascade water purification consists of a series of connected water basins. In the experimental area in Park Lingezegen the inlet water flows into a settling basin, where particulate nutrients can settle into sludge. In the experimental ditches at RU the inlet water infiltrates in an iron rich soil sown with flood tolerant plants. Subsequently the water flows to water basins with reed, bulrush or yellow iris. Because these helophytes pump oxygen through their stems from the atmosphere into their rhizosphere a coupling of nitrification and denitrification processes takes place at the root-soil interface due to which dinitrogen gas is emitted to the atmosphere and the nitrogen load of the system is reduced. After the helophyte filter the water enters a water basin with submerged aquatic plants for water polishing purposes. Depending on the phosphorus (P) loads in the system, a final step in the bio cascade takes place when the water passes a filter consisting of iron-coated sand, as is the case in the experimental ditches at RU.

Figure 1: This graphic indicates how, since the realisation of the bio cascade in summer of 2014 the total concentration of phosphate (P) in the water decreases from an average of two times the European Water Guideline (0,3 milligrams per litre in the intake water to less than 0.05 milligrams per litre) after passing the iron sand. These results are achieved by the running through of several compartments of the bio cascade. The grey dotted line indicates the phosphate guideline norm

Discharging phase
On longer time scales the accumulation of P to soil particles in the bio cascade water purification system is inevitable. Usually the primary production rates of aquatic plants are too slow to compensate for the supply of P via the water and the release of P from the soil. When measurements show that this is the case, as indicated by soil and water quality parameters, the system will be completely inundated. Due to the presence of reactive organic material at the bottom this will cause the soil to become anoxic and P to be released from the Fe containing soil particles. Floating aquatic plants promote this process because they seal off the water surface preventing oxygen diffusion into the water layer due to which the redox depended mobilisation of P may continue as P diffuses into the overlaying water. Here the floating plants species may take up the P in their biomass. By regularly harvesting the plants P may be removed from the system. Then, after a desiccation period, the soil in the bio cascade water purification system is able to bind P again from the infiltrating water. This creates a regenerative system that through manageable changes in redox potential, and associated nutrient conversions, can be charged and discharged. Within the time span of Project RichWaterWorld this stage has not yet been reached in neither of the bio cascades in Park Lingezegen or at RU.

Figuur 2: The total of methane production is compared to the fermentation speed of the plant material. It is shown that water plants like Sparganium erectum, Najas marina and elodea have a high biogas potential, comparable to that of silage maize

In the bio cascade purification system biomass is produced. Within the framework of RichWaterWorld a first survey was conducted on possible applications of the biomass in bio based products. The biomass can, for instance, be used in food industry (meat substitutes for instance) or for the production of glue or green fertiliser. In addition, biomass residues can be converted to biogas which in turn can be converted to energy and heat. Figure 2 shows that the methane yield of for instance elodea is just as high as more conventional biogas crops like silage maize.

Conclusions

RichWaterWorld shows the possibility to combine water storage and retention together with water purification in one and the same area. As a consequence of the complex geohydrological situation and the changing impact of water levels in the river Rhine, the available water storage capacity in Park Lingezegen is not always fully utilized. Supported by the adaptive water management tool, developed in this project, water managers can be advised on preventive inlet or discharge of water in the water storage basin, anticipating on weather forecast and predicted water levels in the river Rhine.
Water retention offers good chances for biogeochemical water purification using a bio cascade system. During the period of water available in the storage basin, nutrients can partly settle in the sludge and partly being absorbed by water plants. N and P are removed for almost 100 per cent by dedicated water management and frequently harvesting the plant material. Regular harvesting offers possibilities for biomass applications such as recovery of proteins and sustainable energy by bio gasification.

The RichWaterWorld consortium consists of public and private partners and knowledge institutes. This partnership has facilitated that public goals have been realized as well as commercial products have been developed in the project, such as an advice tool for adaptive water management and a well-functioning bio cascade water purification.

RichWaterWorld is carried out by a consortium consisting of the knowledge institute Radboud University Nijmegen and Alterra Wageningen UR, the companies MeteoGroup, Eijkelkamp Soil & Water, B-Ware Research Centre and Alliander and Park Lingezegen as public partner. Projectleader is Thea van Kemenade, Radboud University Nijmegen.

Cees Kwakernaak
(Alterra Wageningen UR)
Peter Jansen
(Alterra Wageningen UR)
Monique van Kempen
(Radboud Universiteit Nijmegen)
Fons Smolders
(B-Ware Research Centre)
Hans van Rheenen
(Eijkelkamp Soil & Water)

Summary

Because of climate change adequate supplies of fresh water are not secured anymore, not even in the Betuwe area between the rivers Rhine and Waal. Besides more room for water storage (against flooding) it is becoming more and more necessary to conserve water to combat water shortage. In the project RichWaterWorld, carried out in Park Lingezegen, an innovative concept for adaptive water management has been developed and tested to combine measures against both water challenges in the same area. Before nutrient-rich stored surface water can be re-used the content of phosphate (P) and nitrogen (N) needs to be reduced. In this project an innovative bio cascade purification systsem has been applied and tested. It uses soil processes and water and swamp plants to absorb N and P from the water. Perspectives for re-using the harvested biomass to make bio based products and energy seem to be positive. RichWaterWorld has given insight how different regional water challenges can be dissolved in an integrated and sustainable way.


Literature


www.richwaterworld.com

Massop H.Th.L., 2014. Outline Watersystem. Overbetuwe Watersysteembeschrijving Alterra-report 2531. (in Dutch)Wageningen.

^ Back to start

RICHWATERWORLD

Store and clean water

Knowledge journal / Edition 2 / 2015

How much water is the city evaporating?

How much water does a city lose by evaporation? And what does that imply? Can the evaporation process be influenced? Research from Alterra Wageningen UR provides insights that will become more and more important for cities.

The demand for fresh water is increasing. At the same time the climate is changing, causing more drought and increasing heat in the summer in the Netherlands. Fresh water supply and demand are unbalanced more and more often. That is a problem, especially for cities.
On average cities are warmer than their surrounding rural area. Analyses performed in the framework of the Dutch Delta program indicate that water shortage in cities can lead to damage concerning health, infrastructure and economy.

For measures to prevent this damage and to optimize the division of fresh water in times of drought and heat, knowledge about the demand for water in cities and its dynamics is essential. This was also concluded in the analysis of the Delta program. At the same time it became evident that there are many gaps and there is much uncertainty in our knowledge regarding this issue.
For instance, what do we know about evaporation in a city? Through evaporation valuable water ‘disappears’. On the other hand, evaporation needs energy, which means that it can help to limit heat in cities. Many measures to reduce heat in the city, such as greening, are therefore partly or almost entirely based on cooling through evaporation, as long as water availability is sufficient.


Evaporation in Arnhem

Since June 2012 Alterra Wageningen UR has been measuring evaporation in the centre of Arnhem using the so-called eddy-covariance (ec) technique. This meteorological technique is commonly applied internationally. Most ec-measurements are carried out over vegetated areas (forest, grass, etc.), but in the past few years an international network has developed with a special focus on cities. The monitoring station in Arnhem is part of that urban network.

The evaporation measurements have started in the context of the research program Climate Proof Cities (Albers et al. 2015). For a longer period of time the observations represent a circle with a radius of approximately 1 kilometre around the monitoring point in Arnhem. This part of the city is impervious for 87 per cent and covered with vegetation for 12 per cent. The remaining 1 per cent is open water.
Besides evaporation measurements, standard weather observations are carried out: rainfall, solar radiation, wind speed, temperature and air humidity. Those data are used in our research to evaluate simple methods for estimating city evaporation. Contrary to the specialist ec-technique, such methods are broadly applicable. In that sense they are more suited to estimate urban evaporation in daily practice and to monitor actual drought situations.

An often used and investigated possibility to estimate the evaporation in a city is the use of the so-called reference evaporation. This method has been applied in agriculture for many years to determine the water demand for crops. The reference evaporation represents the evaporation of healthy and well-watered grassland. It is calculated from generally available standard weather data.
But a city is not a fresh meadow. So it is useful to check the validity of the assumptions underlying the method. We can use our measurements to compare the calculated reference evaporation to the actual evaporation obtained from the ec-measurements. The reference evaporation is calculated using the method of the Royal Netherlands Meteorological institute, applied among others in the drought monitor of the Department of Waterways and Public Works.

Figure 1: measured daily evaporation in the centre of Arnhem (black) in 2013 and 2014. The green background shows days with 1 millimetre or more rainfall

Figure 1 shows in black the directly measured daily evaporation in Arnhem for two complete calendar years: 2013 and 2014. The green background indicates wet days, with a measured rainfall of 1 millimetre or more. According to these measurements the total evaporation was 251 millimetres in 2013 and 286 millimetres in 2014. This amounts to 35 per cent and 30 per cent, respectively, of the measured rainfall in those years (722 millimetres in 2013 and 942 millimetres in 2014).
Our results can be compared to a number of recent estimations of urban evaporation, based on a simple linear relationship between evaporation and the percentage of impervious surface in the city, as assumed in the report Studie naar de huidige en toekomstige waterbehoefte van stedelijke gebieden (Study into the current and future water need of urban areas) (De Graaf et al. 2013, in Dutch).

According to that method evaporation of a completely unsealed surface is equal to the one in the rural area, 500 millimetres, calculated based on the reference evaporation. The evaporation at 100 per cent sealed surface is very uncertain and varies between 0 and over 100 millimetres per year. Especially this uncertainty and that in the degree of surface sealing itself cause a considerable spread in the evaporation estimate: 255 to 412 millimetres per year for an ‘average’ city in the Netherlands. At the relatively high fraction of impervious surface (87 per cent) in the centre of Arnhem the same method produces an annual evaporation of 200 millimetres or less.

In the period of our observations evaporation in the centre of Arnhem was clearly more than was to be expected based on the aforementioned method. A possible explanation is the relatively high evaporation measured on rainy days and their subsequent dry days, as shown in figure 1.

Estimation method

The strong response of evaporation to rainfall is also important with regard to the possible application of traditional reference evaporation as an estimation method. This response is investigated in more detail by categorising the daily actual evaporation and the reference evaporation by rainfall rate. Subsequently the amounts of evaporation in each data group are averaged. The analyses focus on the summer half-year, from April to September. The results shown in figure 2 indicate that the measured evaporation strongly increases with rainfall rate, whereas the calculated reference evaporation decreases. On rainy days the city is apparently capable of evaporating the water more efficiently than grassland is, probably because of the solar energy stored in city material.

Figure 2: Response of observed evaporation and reference evaporation in Arnhem to precipitation

In addition to the effect shown in the figure there is a second effect. Many buildings in the centre of Arnhem have flat roofs. Rainwater storage on these roofs forms an interception reservoir. This causes the actual evaporation to increase. The effect is noticeable in the measurements up to three to four dry days after a rainy day. As the measured actual evaporation gradually decreases during the drying of the roofs, calculated reference evaporation on average increases.
Besides this difference in behaviour it is notable that the measured actual evaporation does not show a clear seasonal pattern (figure 1) whereas the calculated reference evaporation normally shows an obvious maximum in summer. In using the reference evaporation as a standard for the urban evaporation the water demand of the centre of Arnhem would probably tend to be overestimated in the summer period. This is an important observation with regard to fresh water usage during dry periods.

Interception model

In short, the traditional reference evaporation seems to be unsuitable for a simple estimation of the actual urban evaporation on a district or city scale. An urban interception model may provide a solution, and does not need to be complicated. Our measurements offer the possibility to evaluate and calibrate such a model and make it applicable to other cities as well.

To what extent does evaporation contribute to heat reduction? The evaporation during summer periods in our measurements is analysed once more in order to answer this question. The daily evaporation in the summers of 2012-2014 was on average about 0.9 millimetres per day. The energy required for evaporation is equivalent to 15 per cent of the incoming solar radiation. Rough estimates for a large city, using a simple meteorological model and assuming clear summer weather in the Netherlands, suggest that this evaporation could reduce the maximum temperature by 1 to 2 degrees. This is only a small reduction at first sight, but such a cooling can significantly improve human thermal comfort.

Knowledge on the functioning of evaporation, as deduced from the observations, can add to the optimisation of cooling by evaporation based on design principles that are used for climate proofing. The on-going evaporation in dry periods after a wet day suggests that evaporation can be influenced by construction and design. Green roofs and other structures can store rainwater temporarily and help to sustain evaporation for a few days. Thus, it is possible in principle to spread the corresponding cooling process over the course of several days without using extra water. However this means that the water is no longer available for other purposes, such as replenishment of ground water.

Our results can help to estimate urban water demand more correctly, for instance via measurements that allow testing and improving models. Use of such models can support the design of cities and the optimization of water management.

Cor Jacobs
(Alterra Wageningen UR)
Jan Elbers
(Alterra Wageningen UR)
Eddy Moors
(Alterra Wageningen UR)
Bert van Hove
(Wageningen University)

Summary

Urban water loss by evaporation is an important but very uncertain factor in the water demand of a city. While representing water loss, evaporation can help to cool down the urban area. In future it will become increasingly important to balance the advantages of cooling by evaporation and the disadvantage of water loss. To fill the current knowledge gap regarding urban evaporation, direct measurements of evaporation are carried out in the centre of Arnhem. Such measurements supply reliable data to design and evaluate models and methods in support of decision making on water management related to cooling and city design. According to the measurements the evaporation was 30 to 40 per cent of the annual rainfall in 2013-2014, and contributed to cooling in summer. On a yearly basis evaporation was surprisingly large, partly because of the strong evaporation during rainy days. Using the traditional reference evaporation as the basis for a simple method to estimate urban evaporation appears to give unreliable results for a city like Arnhem.


Literature


Albers, R., P. Bosch, B. Blocken, A. Van Den Dobbelsteen, L. Van Hove, T. Spit, F. Van De Ven, T. Van Hooff and V. Rovers (2015). Overview of challenges and achievements in the Climate Adaptation of Cities and in the Climate Proof Cities program. In: Building and Environment 83: 1-10.

De Graaf, R.E., B. Roeffen, T. den Ouden en B. Souwer (2013). Study of current and future water demand in urban areas (in Dutch) Rapport Deltasync bv, Delft.

^ Back to start

CITIES

How much is a city evaporating?

Knowledge journal / Edition 2 / 2015

Decision support

How to manage emerging substances in water

Emerging substances are frequently detected in surface water. How do we know which substances pose the highest risk for people and environment? How do we know which approach is the most efficient under certain conditions? A web-based system to support these decisions is being developed in a European context.

Emerging substances are continuously detected in surface water, many of these substances has possible toxic side effects (such as endocrine disruption and the consequences thereof) for the aquatic environment, and are forming a potential risk for drinking water production.
It is often unclear which substances poses the highest risk to people and the environment and therefore should be the first priority. These issues can be dealt with in various ways. They can be implemented at the source (safe design and market authorisation of material), at the ‘end of the pipe’ (drinking water treatment) or anywhere in between.

Which of these strategies is most effective in a specific situation is not always clear to those involved. Also, parties do not always have the same interests or will to cooperate when solutions need to be agreed upon. So, how do you manage this?

The European Interreg project TAPES (Transnational Action Programme on Emerging Substances) was founded to find practical solutions. Parties from each part of the water cycle cooperate in the project: Waternet, KWR Watercycle Research Institute, TU Delft and water board De Dommel are the Dutch project partners. TAPES aims to produce and test a well-designed decision support system (DSS) that can help actors in the water cycle with managing emerging substances.


What is a DSS?

Such a decision support system (DSS) is a computerized technological solution, used to support decision-making specifically when trying to solve complex problems. In spite of their many pitfalls DSSs are very popular (Newman, Lynch et al. 1999; Power and Sharda 2007). Often they are insufficiently tailored to the requests of the target group. What questions do they want answered? What knowledge is already available in the target group? Furthermore, decision support systems are often not further developed or updated; in this case they very quickly become out-dated.

In the context of TAPES ten stakeholders from the water sector have been interviewed:
employees from a drinking water company, a wastewater treatment plant, a water board, two research institutions and a water cycle company. The main conclusion from the interviews was that there is no struggle with a lack of information; the struggle is how to decide which information is relevant. The main issues mentioned are:

1. Emerging substances in surface water:
a. What are the sources?
b. Are there adverse effects on human health, the ecosystem or susceptible functions of the water system?

2. Possible mittigation measures:
a. Which measures can be taken, what is the removal efficiency and what are the costs?
b. On what location is the measure most efficient?

3. Long-term solutions versus short-term solutions?

4. What are possible future scenario’s, for instance regarding climate change, technology, demography, etc.?

5. Which aspects have not been investigated yet and are still to be answered (new research questions)?

Figure 1: Information required to answer the main questions in the decision support system, namely: what are the sources, which adverse effects can be expected, which mitigation measures are possible and where are they most effective?

TAPES focuses on the first two points including their sub questions. As a start TAPES focuses on twenty emerging substances that were defined as problematic by the stakeholders, the substances covers a wide range of physical-chemical properties. Based on the results from the interviews a diagram on the necessary information to answer the chosen questions for the decision support system-emerging substances and measures (DSS-ESM) was drawn (figure 1).

Result

The result is a web-based knowledge platform that contains information on emerging substances in the water cycle. The information is available as a substance specific factsheet or the user can upload surface water monitoring data of emerging substances and based on this get information on their specific water.

The factsheet, that in the meantime has become available for about twenty substances in combination with water treatment techniques, contains the following information:
• The type of compound: pharmaceutical, plant protection product, flame retardant, industrial by-product, solvent or other.
• Source of the compound: households and healthcare institutions, agriculture, industry and trade, traffic or users of surface water (including shipping).
• Input route: for example through the effluent of a waste water treatment plant or as runoff from fields, this way the best location to apply measures can be decided.
• The most important chemical and physical characteristics of the compound, relevant to its removal in various water treatment techniques.
• Toxicity data regarding safe levels of exposure for humans.
• Toxicity data regarding safe levels of concentrations in the environment.
• Overview of relevant policies (European Water Framework Directive, the Dutch Drinking water law, etc.).
• Overview of central technical mitigation methods; this entails the most common water treatment techniques (wastewater and drinking water) including references to relevant literature.
• Overview of decentred technical and non-technical mitigation methods; policies, awareness campaigns for consumers, covenants with farmers, removal directly at hospitals, retention filters at sewage overflow etc.

When measurement data is uploaded, a compact version of the factsheet is displayed for several compounds (up to 5), based on the measurement data. Providing the user information on:
• Types of compounds: pharmaceutical, plant protection products, flame retardant, industrial by-product, solvent or other.
• Sources of the compounds: households and healthcare institutions, agriculture, industry and trade, traffic or users of surface water (inclusive shipping).
• Input route: for instance through the effluent of a wastewater treatment plant or as runoff from fields.
• The most important chemical and physical characteristics of the compounds.
• Humane toxicity: calculated based on the preliminary limit for drinking water as advised by the World Health Organisation (WHO 2011).
• The aquatic Predicted No Effect Concentration (PNEC) if available.
• Overview of central water treatment techniques: removal efficiency of the most common treatment techniques (drinking water and wastewater), including literature references (figure 3).
• Overview of decentred technical and non-technical mitigation methods; policies, awareness campaigns for consumers, farmers covenants, removal on location at hospitals, retention filters at sewage overflow etc.

This DSS-ESM information is partly based on a database from a large literature study on the removal efficiency of water treatment techniques for emerging substances for commonly used techniques, such as advanced oxidation (ozone and UV/H2O2) activated carbon (powdered and granular activated carbon) and membranes (reverse osmosis, ultrafiltration and nano filtration).

Within the TAPES project research was carried out into the removal efficiency of several drinking water treatment techniques (such as UV+H2O2, nano filtration, granular active carbon and affinity absorption) and wastewater treatment techniques (such as powdered activated carbon, ozone, retention filters, UV (+H2O2), the 1-STEP filter of water cycle company Waternet, and Dissolved Air Flotation (DAF)). These results were also included in the DSS-ESM.

A second round of interviews with experts of techniques mentioned in the literature study was held to make the DSS more practice-oriented, highlight the (dis) advantages of the techniques and indicate the parameters that influence the removal efficiency of the techniques. This information has not yet been included in the DSS-ESM, but should in term help the system’s users to better translate the results of the literature study to their own context.
A second literature study on decentred (non) technical mitigation measures for the groups pharmaceuticals, plant protection products and household substances, was also carried out and included in the DSS-ESM.

The DSS-ESM, with all currently available information, is publicly accessible from September 2015 (www.tapes-interreg.eu). However, the system has not yet been extensively tested in practise. The DSS-ESM will provide decision makers with information on the compound characteristics, water cycle entrance, which central technical water treatment techniques seem promising, and eventually which non-technical measures can be taken, to enable quicker and more fit-for-purpose suggestions of solutions suitable for their specific water.

With the DSS-ESM knowledge is available in-house so that preliminary research can be carried out quickly. Resulting in quicker and more efficient decision making on the next steps to be taken, such as a pilot studies of techniques selected based on information from the DSS-ESM, start-up of non-technical measures in a catchment area, etcetera.

Conclusion and follow up

At this moment the DSS-ESM informs actors in the water sector of about twenty emerging substances and the possible measures that could be taken. The ambition is to continue the development of the DSS-ESM and provide more extensive information on how to manage emerging substances.
The new applied scientific component of the DSS-ESM is the integrated approach comprising the whole water cycle. The ambition of the TAPES partners is that the DSS-EMS will become the system used in Europe when looking for information on emerging substances and possible mitigation measures; both for new innovative solutions or already established well-known techniques. An integral approach including the whole water cycle – from source to tap – will in short term lead to more cooperation and consensus in the water sector on the complicated issue of emerging substances in the water cycle and in term to more sustainable solutions.

Astrid Fischer
(TU Delft)
Floris van den Hurk
((TU Delft, Waternet, HZ-University of Applied Sciences)
Annemarie van Wezel
(KWR Watercycle Research Institute, Copernicus Institute, Utrecht University)
Jan Peter van der Hoek
(TU Delft, Waternet)

Summary

Emerging substances are frequently detected in surface water, with possible toxic effects on the aquatic environment, and a potential risk to the drinking water supply. The main question: how can the issue of emerging substances in the water cycle be handled as effectively and efficiently as possible? must be provided with an answer. In the context of the European Interreg project TAPES (Transnational Action Programme on Emerging Substances) a decision support system has been developed as an answer to this question. This web based knowledge platform provides information on emerging substances and corresponding measures. The goal is to improve cooperation and consensus in the water sector and to come to sustainable solutions.


Literature


Newman, S., T. Lynch, et al. (1999). Success and failure of decision support systems: Learning as we go. Proceedings of the American Society of Animal Science.

Power, D. J. and R. Sharda (2007). Model-driven decision support systems: Concepts and research directions. Decision Support Systems 43(3): 1044-1061.

WHO (2011). Guidelines for Drinking water Quality fourth edition, WHO.

^ Back to start

DECISION SUPPORT

Emerging substances in water

Knowledge journal / Edition 2 / 2015

Effects of water
management
on crop yield

A new instrument for the quantification of agricultural crop yield reduction due to too wet, too dry or too salty conditions: what kind of instrument should that be? And could such an instrument be usable for the calculation of effects of climate scenarios? WaterVision Agriculture should be the answer to these questions.

Plant growth is determined by the availability of solar radiation, CO2, water, oxygen, salt and soil nutrients. To achieve maximal growth plants always try to take sufficient water and oxygen from the soil. When the availability of water (too dry) or oxygen (too wet) in the root zone is insufficient, plants will undergo either drought or oxygen stress. When the salt concentration in soil water is too high, the water uptake will decrease.

The climate is changing and weather conditions are becoming more capricious. As a consequence the current instruments are no longer sufficient for the determination of the direct effect of hydrological conditions in the root zone on agricultural yield. Different groups of users, like water boards, provinces, drinking water companies and the Department of Waterways and Public Works are therefore demanding a climate-proof instrument that can determine crop yield effects as a result of drought, too wet or too saline conditions.

WaterVision Agriculture should become that new instrument. An instrument that can simulate soil hydrology and crop growth on the basis of different weather conditions and future climate. Based on currently available knowledge in this field and user-friendly. For agriculture it is important that the effects are expressed in actual crop yield changes and farm economic interpretation.

Meanwhile the project WaterVision Agriculture has already supplied a few products. In this method the agro hydrological simulation model SWAP and the crop growth simulation model WOFOST together form the core of the calculation of crop yields as a function of soil moisture conditions. Based on these specialist models practically applicable functions are being assessed. This article addresses the usability of the connected model instruments and offers a view to potential applications. The ultimate goal is replacing the current methods for calculation of agricultural effect of hydrological changes by one new method.

On the one hand crop yields are affected by interference in the water balance and its effect on crop transpiration (the so-called direct effects) and on the other hand due to indirect effects, partly as a result of land management.
Such indirect effects are for instance the result of workability problems, decrease in crop quality or damage to the soil structure. This article focusses on the first category; the indirect effects are dealt with further in the investigation.

Figure 1: Stream scheme of crop growth processes in WOFOST


Background

Since long Dutch water management has been familiar with different methods for quantifying impact of hydrology on agricultural yield. Water boards use the so-called HELP-tables to read out the amount of loss of revenue based on information on soil profile, groundwater level and crop type. These HELP-tables have been developed to determine the effects of water management measures on the yield of agricultural crops in land development projects, and show annual average yield reduction over many years.

For the calculation of disappointing revenue as a result of permanent ground water extraction the Advice Committee Damage Ground Water (ACSG) uses the TCGB-tables. These tables resemble the HELP-tables, but give a more detailed insight in loss of revenue and only concern grassland on sandy soil.

These frequently used tables are outdated. The determination of drought effects with the HELP tables is based on outdated meteorological data and both too wet and too dry conditions are based on experiences from past agricultural practice. The tables only provide an image of the annual average damages, where information on the variety of damage in time as a result of changing weather conditions is needed. Besides effects of saline conditions are not considered at all.

The HELP- and TCGB-tables are therefore unsuitable for application in both the current and future climate. There is a need for an improved agricultural effect module, already contended in the knowledge program Delta proof of the Foundation for Applied Water Research (STOWA) and in a formerly executed inventory of the need to replace the HELP-tables.

So under auspices of STOWA a wide acknowledgement of the development of a method for determining agricultural effect as a result of agro hydrological circumstances has been realised, based on the agro hydrological model SWAP and the growth simulation model WOFOST. This method can calculate for climate scenarios and obtain climate proof damage relations as well.

Approach and results

The project WaterVision Agriculture covers different phases.
Phase 1 worked towards an operational instrument on the basis of SWAP to calculate damage by drought, too wet and too saline conditions. This was done for grassland, silage maize and potato and the relation with crop transpiration.
Phase 2, executed in 2013 and 2014 resulted in a connection of the agro hydrological model SWAP with the crop simulation model WOFOST to an operational and tested simulation model for grass, potato and silage maize, that can calculate crop transpiration reduction as well as calculate crop yield reduction.


Figure 2: Example calculation of SWAP-WOFOST for grassland (field experiment with multiple cuts in Zegveld) and silage maize (field experiment in Cranendonck). In both figures the observed yield is presented with red dots and two lines for respectively calculated potential and actual yield

The SWAP (Soil-Water-Atmosphere-Plant) model is a widely used model, initiated for the determination of the actual evapotranspiration as a function of meteorological data, combined with crop and soil data. The model simulates for the so-called top system, the unsaturated and saturated upper part of the soil profile, where the interaction between ground and surface water is important. The model SWAP calculates the water transport, dissolved substances and soil temperature.

The WOFOST (WOrld FOod STudies) model calculates the potential crop yield as a function of the CO2-level, solar radiation, temperature and crop characteristics. Subsequently the water availability determines the water-limited crop production when all other factors (nutrients for instance) are optimally available. The basis for the calculation is leaf area and incoming solar radiation. Subsequently the amount of light and CO2 that is intercepted and potentially converted to photosynthesis is calculated. Then the actual photosynthesis is calculated by the reduction of the potential photosynthesis for limited availability of water, or oxygen or too high concentrations of salt.

This speaks volumes about crop growth. Part of the energy that becomes available through photosynthesis is used for maintenance respiration and growth respiration. The residual part is converted to dry matter, that depending on temperature and the development stage of the crop is divided over the different parts of the crop: roots, stems, leaves and storage organs.
The SWAP model uses a so-called static crop with the same assumption on crop development and unchanging values for the leaf area development and roots every year. The dynamic growth of crops can be taken into account in the SWAP-WOFOST connection. This results in a more realistic crop development, varying annually due to meteorology and hydrology. For the hydrological calculations of SWAP more realistic crop dynamics at the top layer of the soil profile is created and also a realistic dynamic development of rooting depth. The connection SWAP-WOFOST supplies a direct calculation of agricultural yield.

With SWAP-WOFOST the influence of extreme weather conditions, such as heavy rainfall intensity, long lasting drought, CO2 increase and fluctuating temperatures are considered when calculating climate scenarios. Different photosynthesis systems of crops can be taken into account as well.
Figure 2 shows an example of the type of calculations that can be made with SWAP-WOFOST. The graphics also show the similarities with measured crop yield.

From model to practical tool

Application of the SWAP-WOFOST model requires specialist knowledge, whereas the demand is to get a simple user-friendly method for the quantification of agricultural yield effects. Based on the detailed SWAP-WOFOST-simulations however, simple relations between ground water characteristics and yield can be derived, applicable without further interference of models. Such relations facilitate the translation of water management conditions to yields because SWAP-WOFOST-simulations are no longer needed for the application of those relations.

Then, groundwater levels, generally measured or modelled, can be translated to yield through simple relations. Distraction of these relations saves a large amount of calculations for the user. The principle for deriving these ‘meta-relations’ has been formerly executed as well: HELP-tables and TCGB-tables are in fact examples of simple relations. At this moment we are working on those simple relations for grass and maize silage.

WaterVision Agriculture enables use of the connected SWAP-WOFOST for:
- Calculating crop yields as a function of hydrology and so generating insight in variation between and also within years, under extreme conditions, of direct effects on crop yield as a result of drought, salt and wet soil water conditions for grassland, silage maize and potato for actual weather and climate projections.
- A ‘customized’ calculation that uses available field data for questions on ecological coherence or level management.

The connection of SWAP and WOFOST that was realised within WaterVision Agriculture for estimating crop yields has supplied a reproducible and verifiable system. In other words: a valuable instrument for the objective determination of crop yield effects and directing measures that aim at water balance interference.

Mirjam Hack-ten Broeke
(Alterra Wageningen UR)
Ruud Bartholomeus
(KWR Watercycle Research Institute)
Joop Kroes
(Alterra Wageningen UR)
Jos van Dam
(Wageningen Universiteit)
Jan van Bakel
(De Bakelse Stroom)

Summary

Different user groups, such as water boards, provinces, drinking water companies and the Department of Waterways and Public Works are in need of a new instrument that can determine crop yield in relation to drought, too wet or saline conditions. Such an instrument is being developed in cooperation with different parties (under auspices of the Foundation for Apllied Water Research (STOWA) regarding the project WaterVision Agriculture. It is important that the instrument is able to simulate for different weather conditions and is suitable for climate scenarios as well. Meanwhile, the project has delivered some products, like the combination of the agro hydrological model SWAP and the crop simulation model WOFOST. These enable calculating crop yield as function of hydrology, getting insight in variation between and also within years, under extreme conditions, of direct effects on crop yield as a result of drought, salt and too wet conditions for grassland, silage maize and potato for actual weather and climate scenarios. This instrument, of which a user-friendly variety is being developed, is a major leap forward.

^ Back to start
AGRICULTURE

Determination of crop yield reduction

Archive


Edition 1/2015

ARCHIVE

Previous editions

Knowledge journal / Edition 2 / 2015

ABOUT WATER MATTERS

The knowledge section Water Matters of H2O is an initiative of


Royal Dutch Waternetwerk
Independent knowledge networking organisation for and by Dutch water professionals.


Water Matters is supported by

Alterra Wageningen University
Research institute that contributes by qualified and independent research to the realisation of a high quality and sustainable green living environment.


ARCADIS
Global natural and built asset design and consultancy firm working to deliver sustainable outcomes through the application of design, consultancy, engineering, project and management services.


Deltares
Independent institute for applied research in the field of water, subsurface and infrastructure. Throughout the world, we work on smart solutions, innovations and applications for people, environment and society.


KWR Watercycle Research Institute
Institute that assists society in optimally organising and using the water cycle by creating knowledge through research; building bridges between science, business and society; promoting societal innovation by applying knowledge.


Royal HaskoningDHV
Independent international engineering and project management consultancy that contributes to a sustainable environment in cooperation with clients and partners.


Foundation for Applied Water Research (STOWA)
Knowledge centre of the regional water managers (mostly the Water Boards) in the Netherlands. Its mission is to develop, collect, distribute and implement applied knowledge, which the water managers need in order to adequately carry out the tasks that their work supports.


Netherlands Water Partnership
United Dutch Water Expertise. A network of 200 Dutch Water Organisations (public and private). One stop shop for water solutions, from watertechnology to coastal engineering, from sensor technology to integrated water solutions for urban deltas.

ABOUT WATER MATTERS